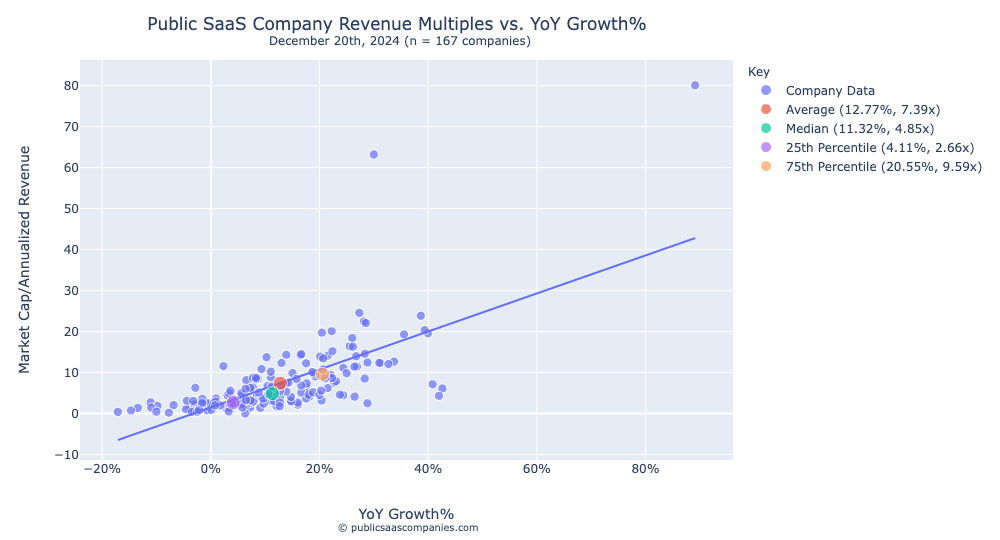
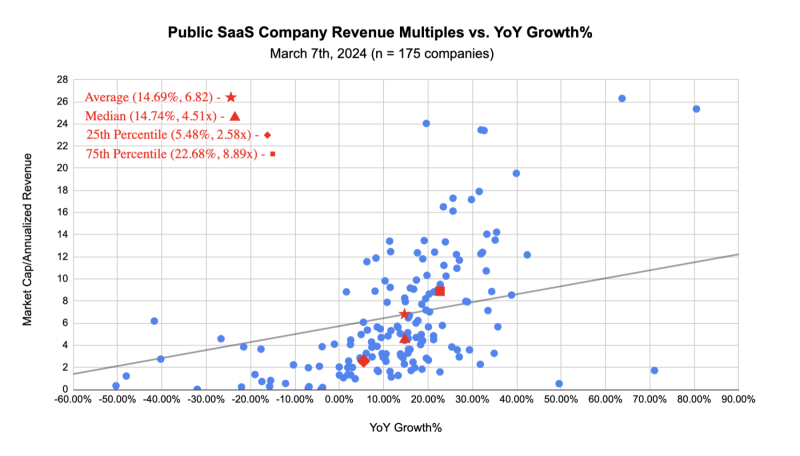
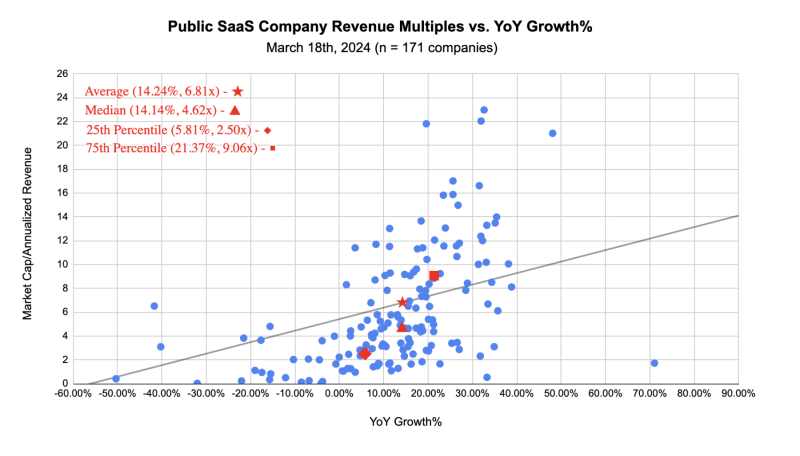
Based on the below analysis of 146 Public SaaS Companies as of April 9th, 2026, the average revenue multiple (on annualized last quarter revenue) is 4.03x while the median revenue multiple is 2.5x. The average Public SaaS company year-over-year revenue growth rate is 14.73%. Hover over any point to see Company Ticker symbol, Revenue Multiple, and YoY Growth rate%. Zoom and pan to focus on any particular cluster of companies. Eight additional variations of this scatter plot can be found below. These analyses are updated at 5 PM EST every weekday.
- Companies in sample: ADBE, AGYS, AKAM, ALIT, ALKT, AMPL, APPF, APPN, APP, ASAN, ASUR, TEAM, ADSK, ADP, AVPT, AWRE, BLZE, BSY, CMRC, BILL, BLND, BOX, BRZE, BMBL, CERT, CHKP, CWAN, NET, CGNT, COUR, CRWD, LAW, CSGS, DDOG, DSGX, APPS, DOCN, DCBO, DOCU, DOMO, DFIN, DV, DOCS, DBX, DUOL, DT, EGAN, EGHT, ESTC, EB, EVCM, EXFY, FFIV, FSLY, FIG, FIVN, FTNT, FRSH, GEN, GENI, GTLB, GDDY, GWRE, HCAT, HUBS, IDN, INTU, FROG, KLTR, KARO, KC, KVYO, LZ, LSPD, LPSN, RAMP, TDOC, MQ, MTCH, MITK, MNDY, MDB, MYSZ, NABL, NCNO, NRDY, NFLX, NICE, OKTA, OSPN, OTEX, ORCL, PD, PLTR, PANW, PAR, PAYC, PCTY, PEGA, PERI, PUBM, QLYS, RXT, RPD, RNG, RSKD, RBRK, RUM, SABR, CRM, IOT, SEMR, S, NOW, SHOP, SMWB, SNOW, SOUN, SPOK, SPOT, CXM, SPT, SPSC, SSNC, SNPS, TEAD, TTGT, TENB, TTD, THRY, TOST, TWLO, UDMY, PATH, UPLD, VRNS, VERX, VTEX, WEAV, WIX, WDAY, YEXT, ZETA, ZM, GTM, ZS
- Excluded outliers: AI, NOTE, OS, CRCL, MSTR, CFLT, APCX
Revenue Multiple vs Rule of 40% (YoY Growth% + EBITDA Margin%)
In the analysis below, each company’s revenue multiple (Market Cap/Annualized Revenue) is compared to its Rule of 40, which is the sum of its YoY Growth% and EBITDA Margin% in the most recent quarter filed.

Revenue Multiple vs Rule of 40% (YoY Growth% + Net Income Margin%)
In the analysis below, each company’s revenue multiple (Market Cap/Annualized Revenue) is compared to its Rule of 40, which is the sum of its YoY Growth% and Net Income Margin% in the most recent quarter filed.

Cash Adjusted Revenue Multiple vs YoY Growth%
Each company’s cash and short-term investments balance is subtracted from its market cap before the revenue multiple is calculated in the analysis below.
Cash Adjusted Revenue Multiple vs Rule of 40% (YoY Growth% + EBITDA Margin%)
In the analysis below, each company’s cash adjusted revenue multiple (Market Cap minus Cash and Short Term Investments/Annualized Revenue) is compared to its Rule of 40, which is the sum of its YoY Growth% and EBITDA Margin% in the most recent quarter filed.
Cash Adjusted Revenue Multiple vs Rule of 40% (YoY Growth% + Net Income Margin%)
In the analysis below, each company’s cash adjusted revenue multiple (Market Cap minus Cash and Short Term Investments/Annualized Revenue) is compared to its Rule of 40, which is the sum of its YoY Growth% and Net Income Margin% in the most recent quarter filed.

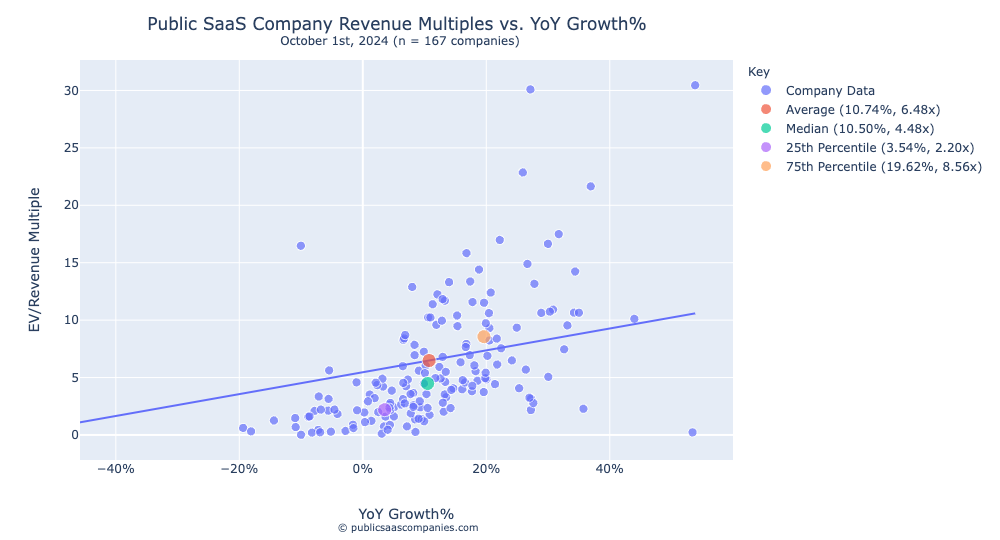
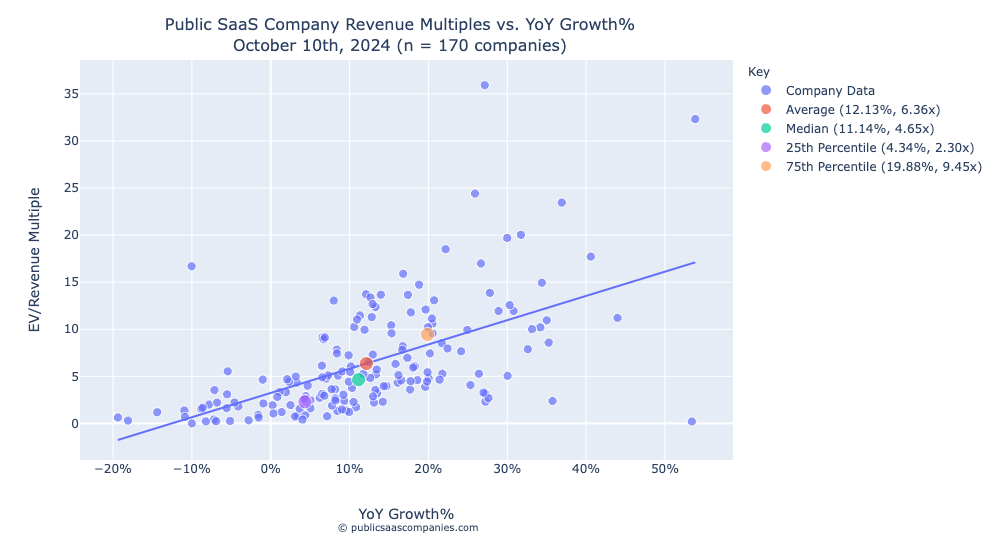
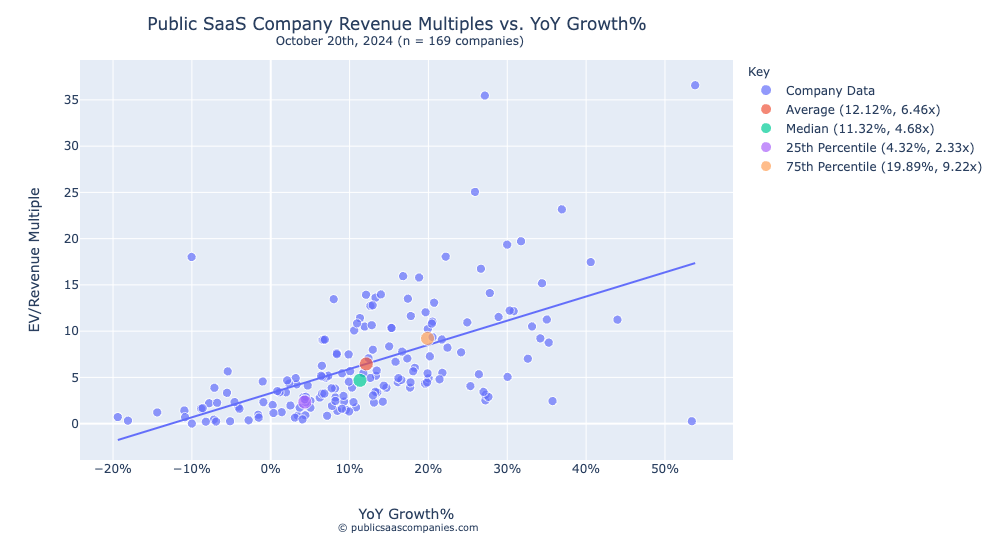
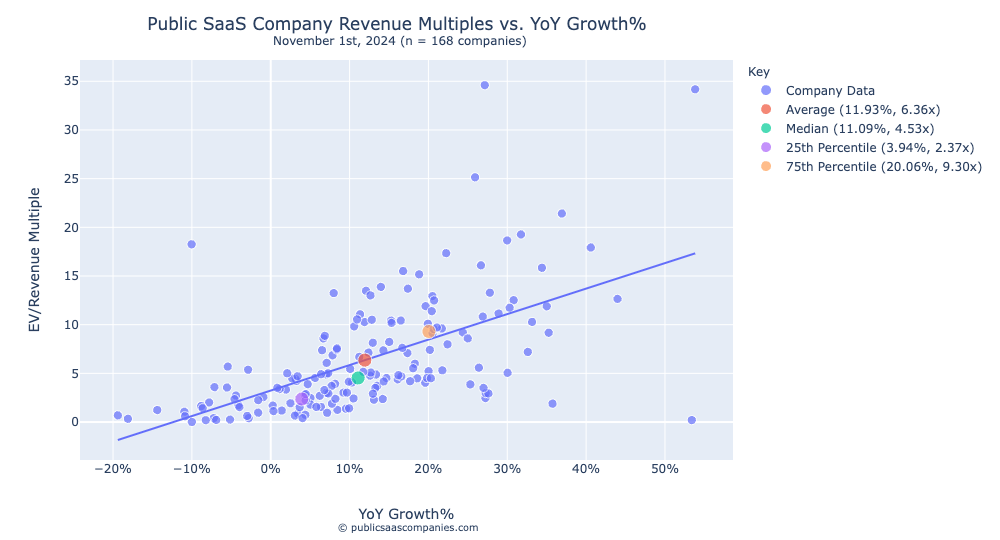
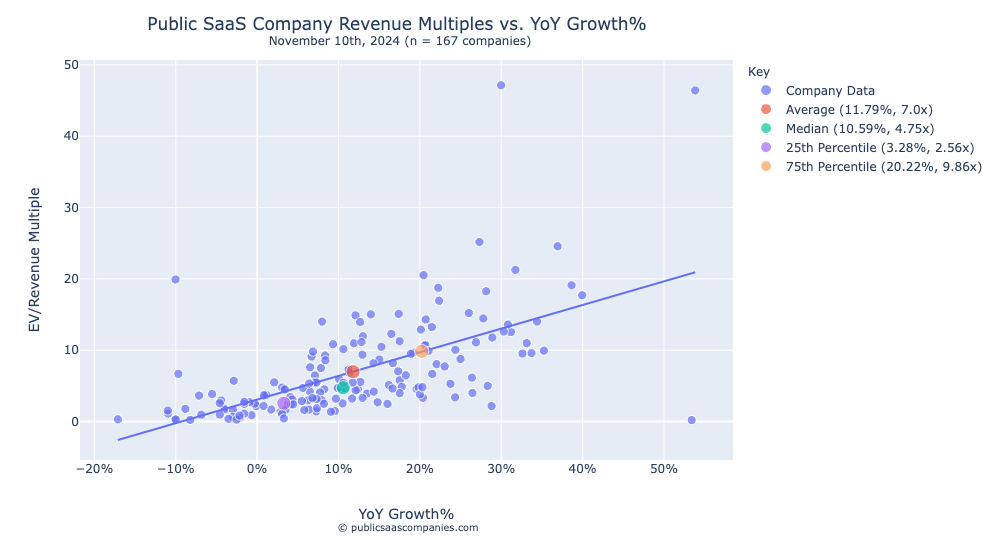
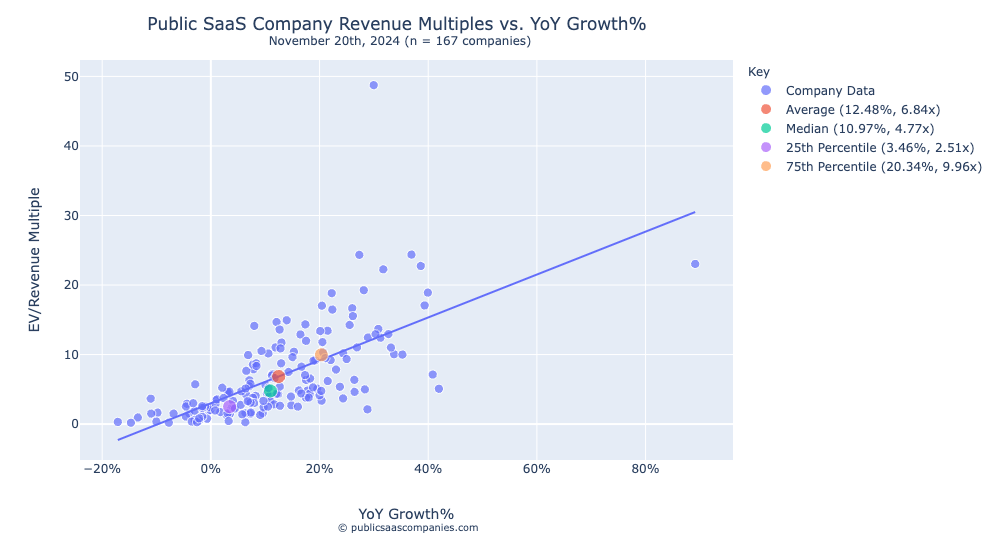
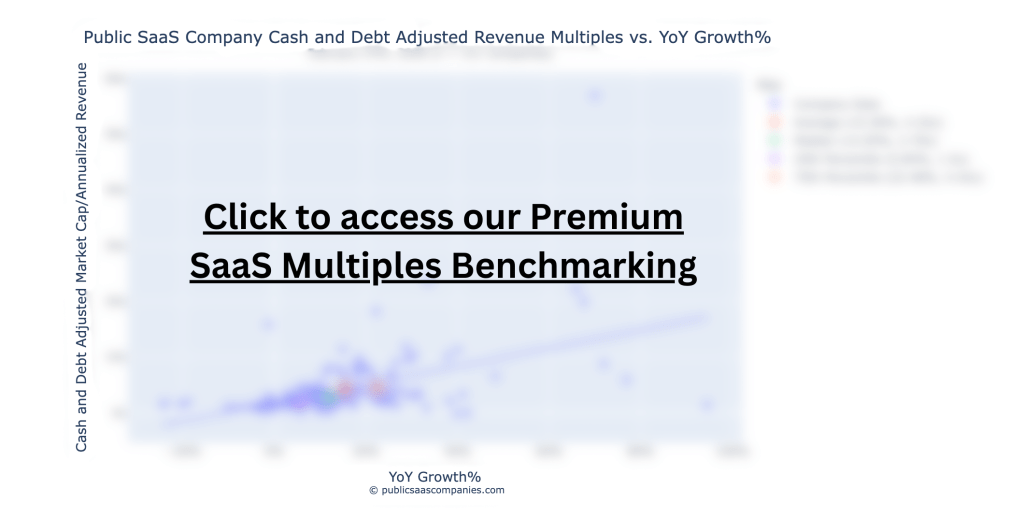
Cash and Debt Adjusted Revenue Multiple vs YoY Growth%
In the analysis below, each company’s Enterprise Value-to-Revenue multiple (EV/Annualized Revenue) is compared to its year-over-year growth in the most recent quarter filed.
EV = (Market Cap – Cash and Short Term Investments + Total Debt).
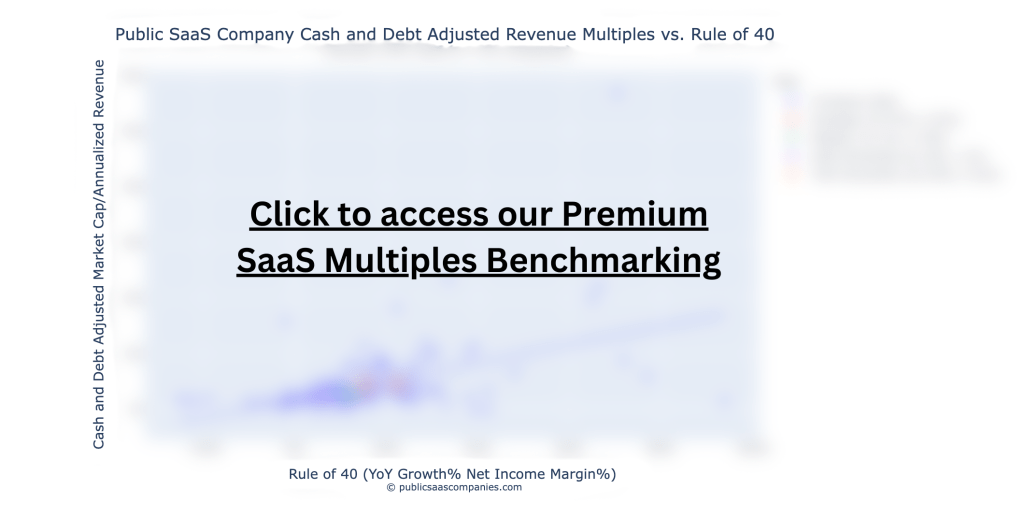
Cash and Debt Adjusted Revenue Multiple vs Rule of 40% (YoY Growth% + EBITDA Margin%)
In the analysis below, each company’s Enterprise Value-to-Revenue multiple (EV/Annualized Revenue) is compared to its Rule of 40 in the most recent quarter filed.
EV = (Market Cap – Cash and Short Term Investments + Total Debt).
Rule of 40 = (YoY Growth% + EBITDA Margin%).

Cash and Debt Adjusted Revenue Multiple vs Rule of 40% (YoY Growth% + Net Income Margin%)
In the analysis below, each company’s Enterprise Value-to-Revenue multiple (EV/Annualized Revenue) is compared to its Rule of 40 in the most recent quarter filed.
EV = (Market Cap – Cash and Short Term Investments + Total Debt).
Rule of 40 = (YoY Growth% + Net Income Margin%).
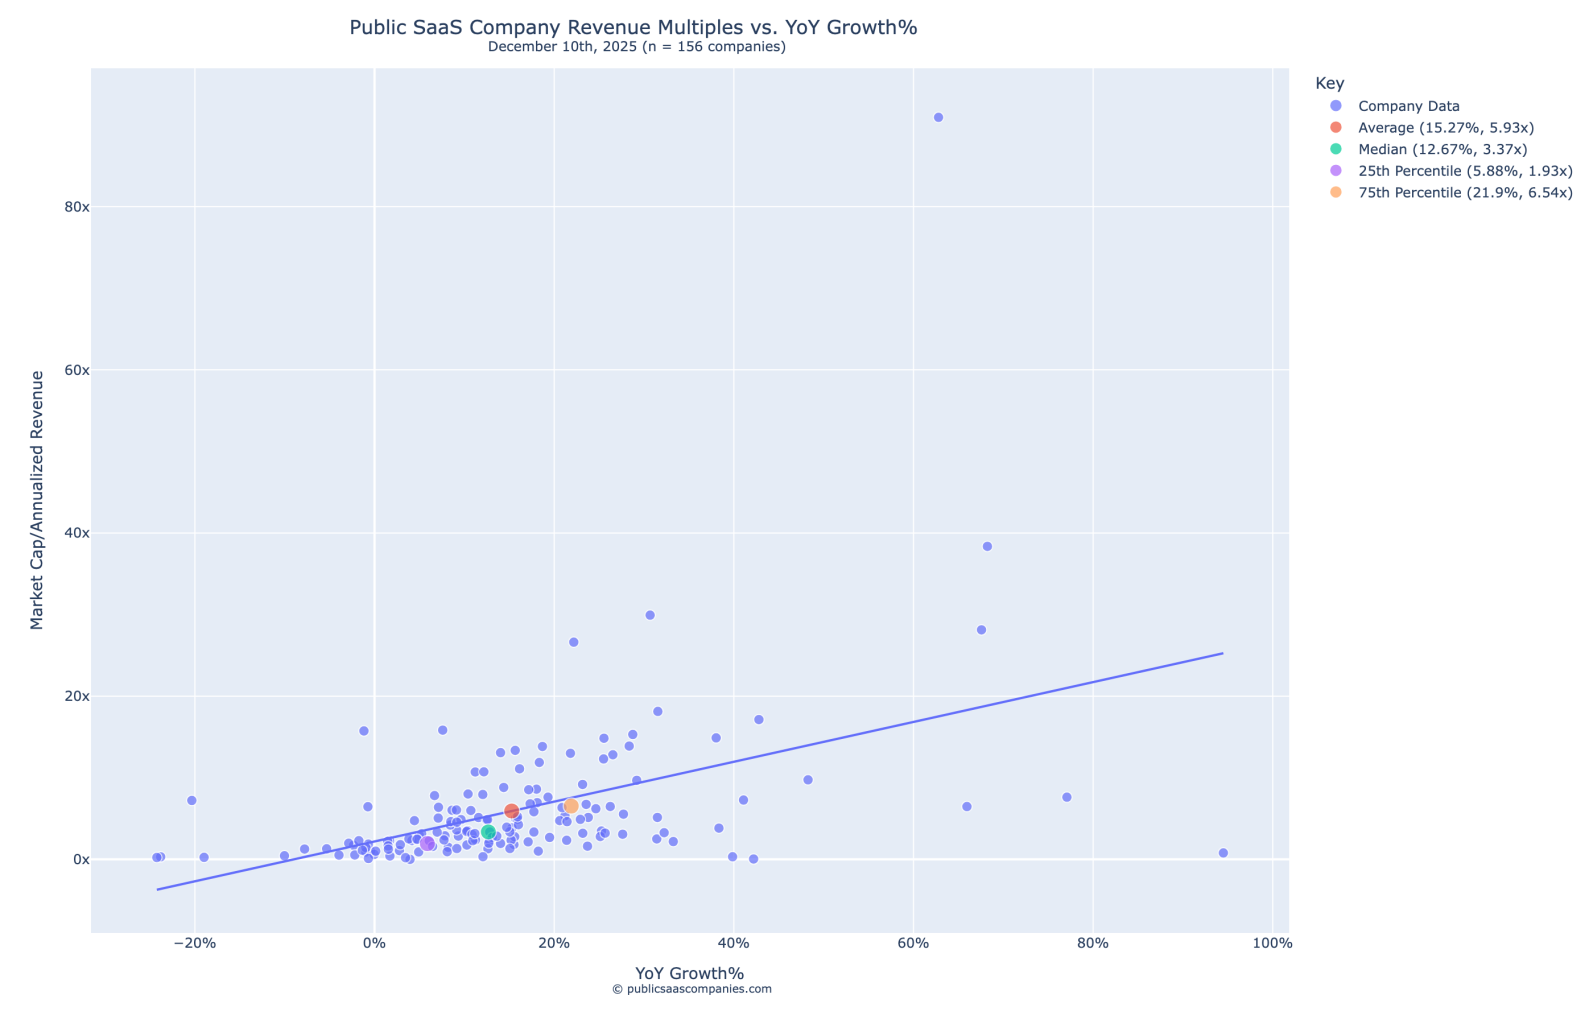
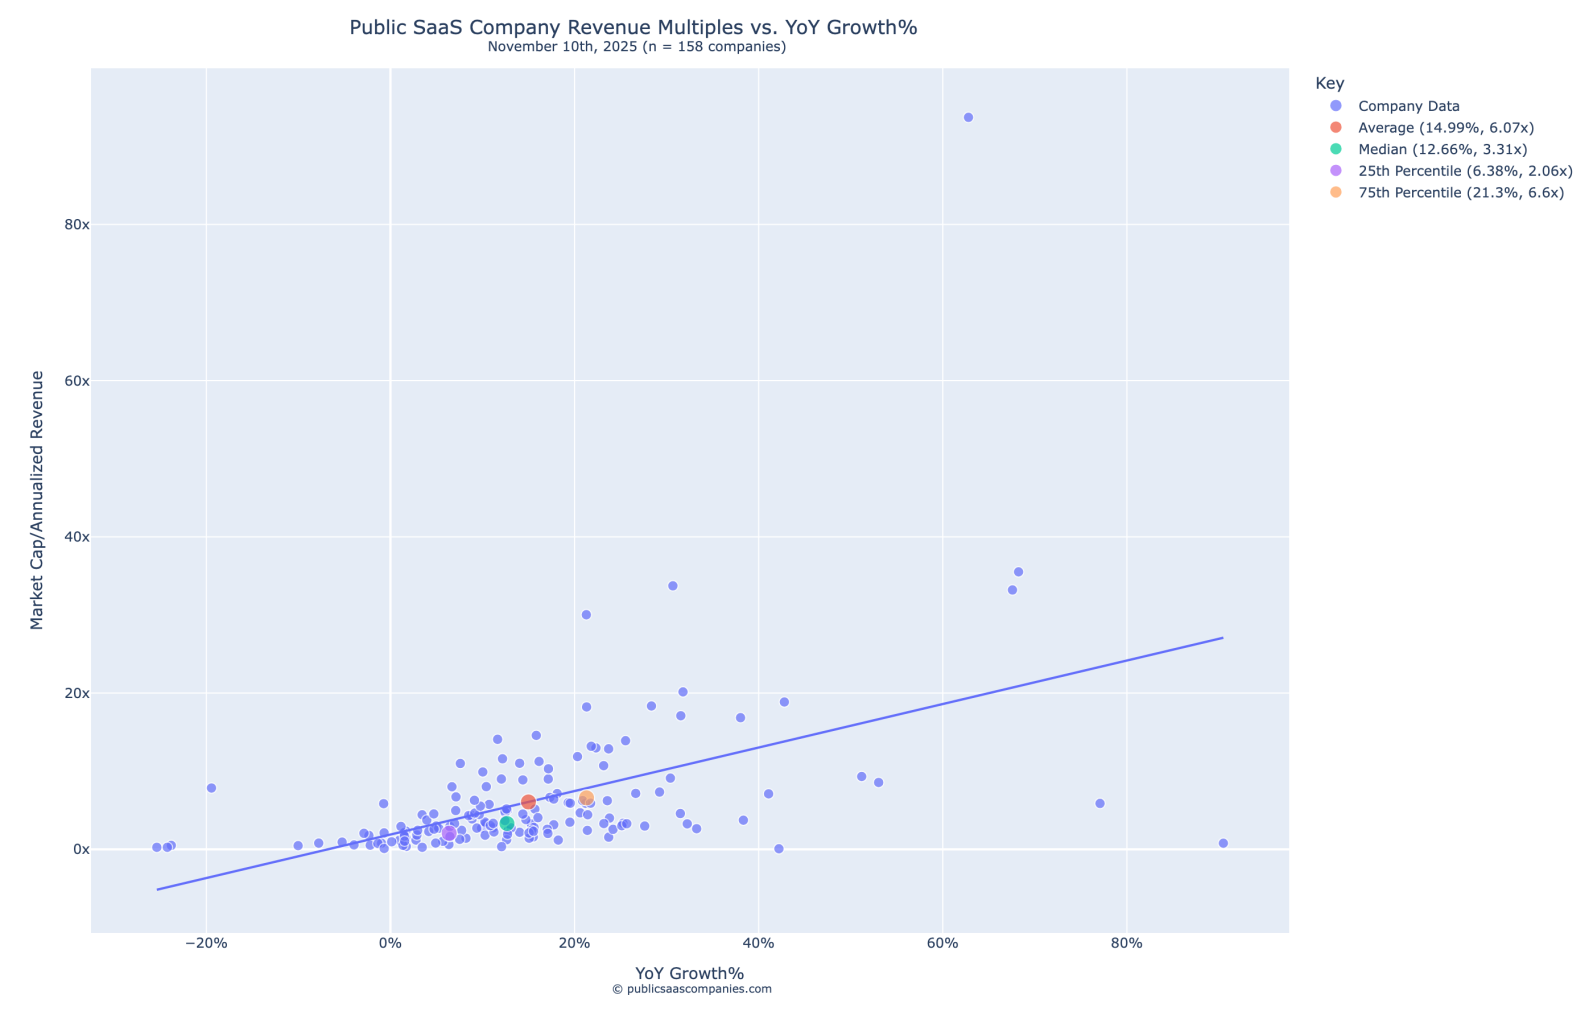
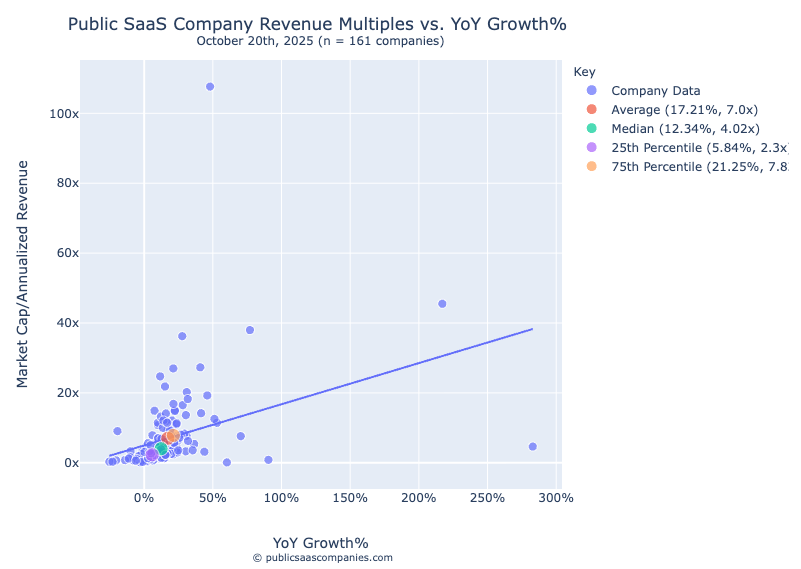
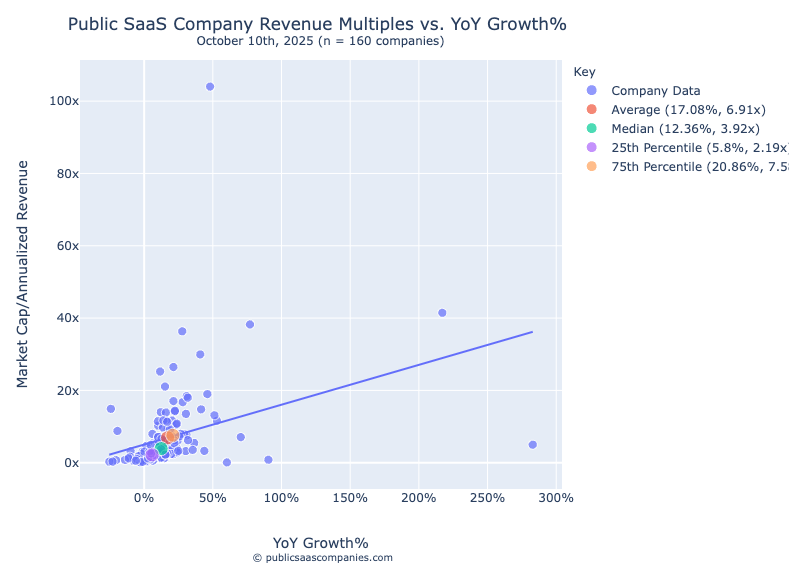
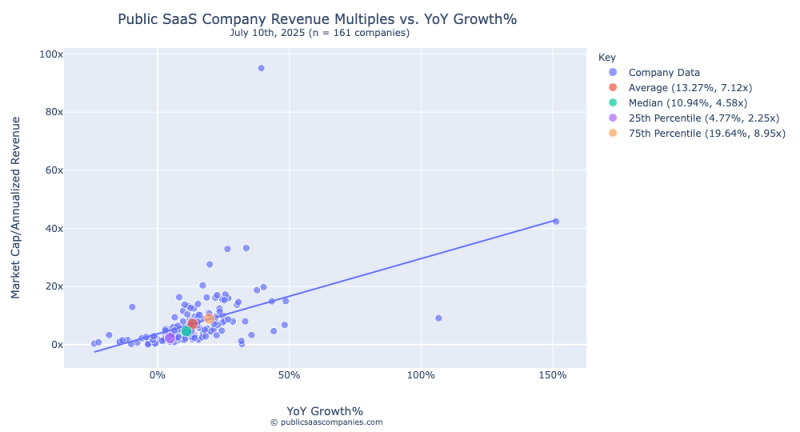
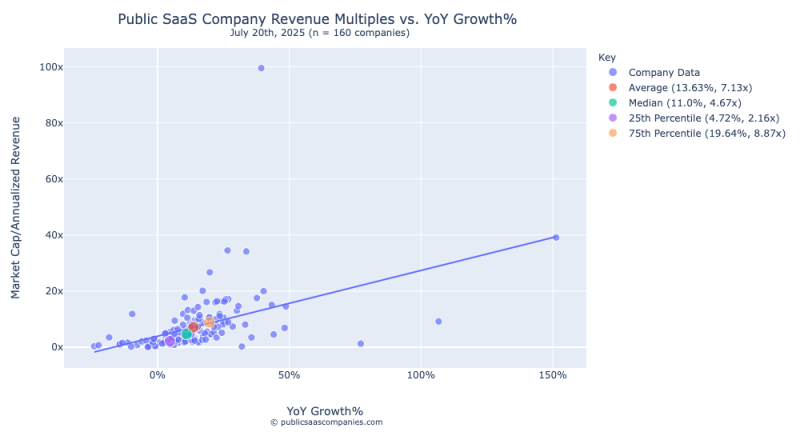
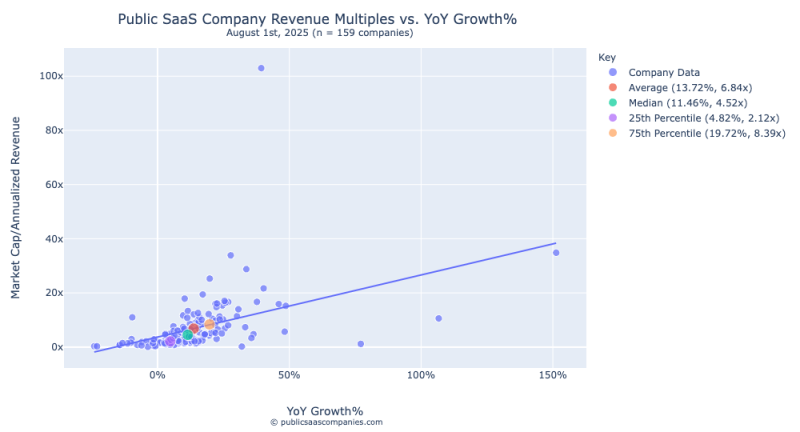
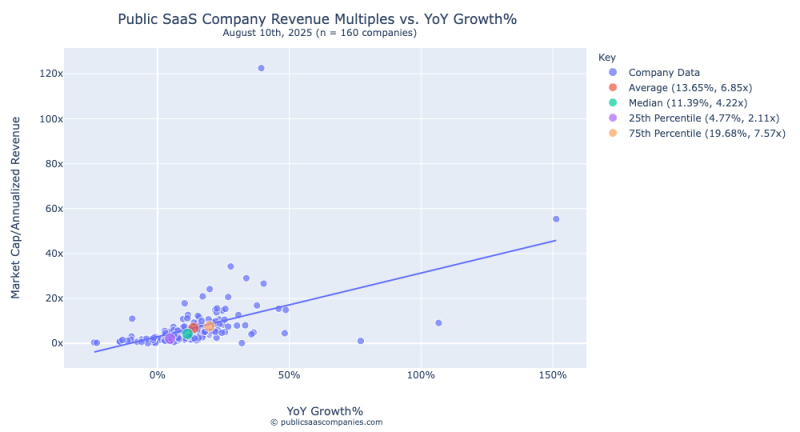
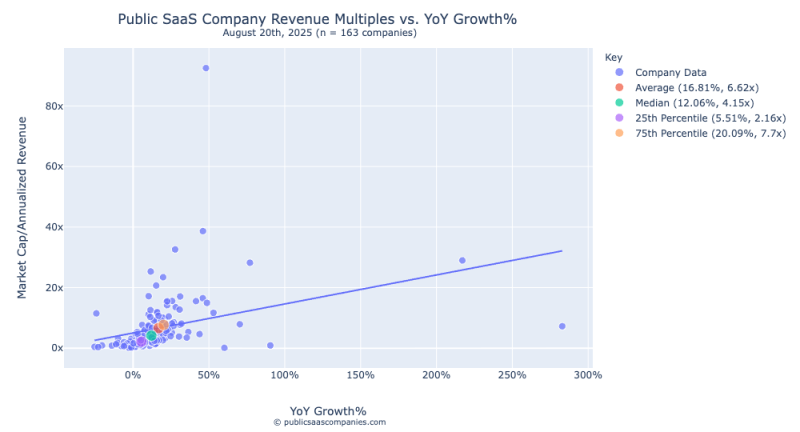
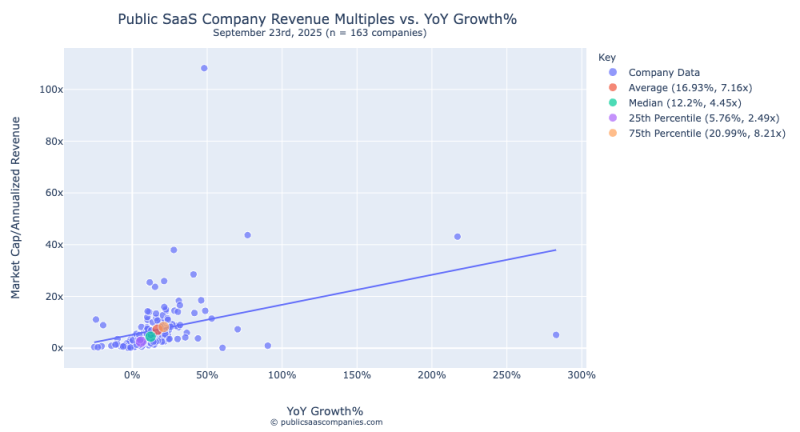
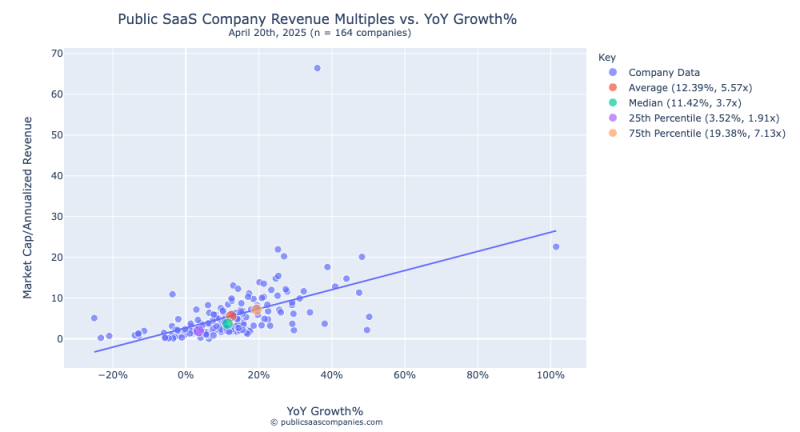
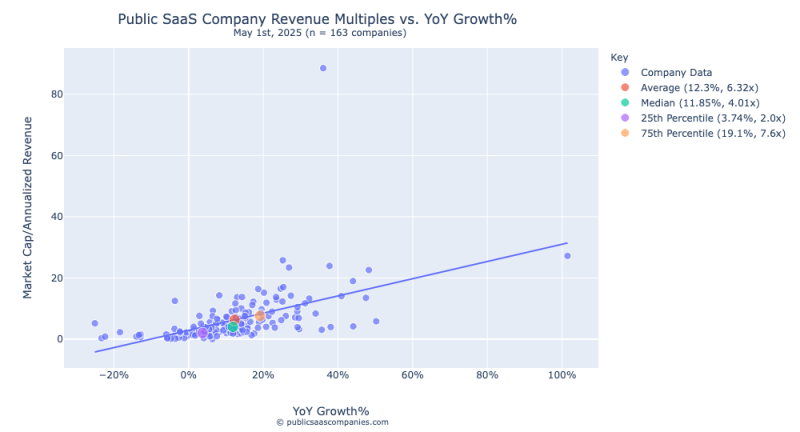
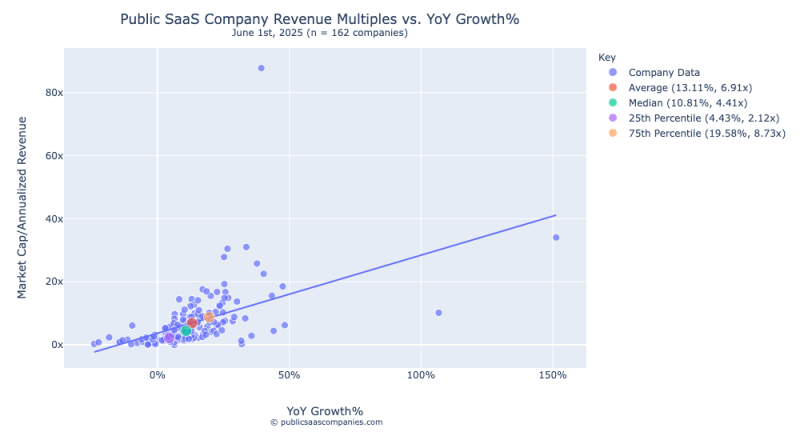
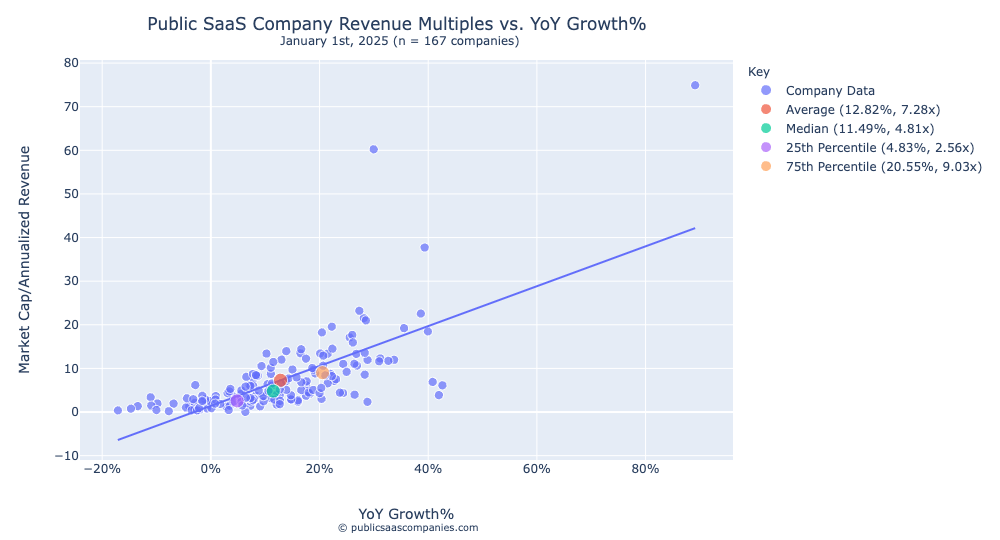
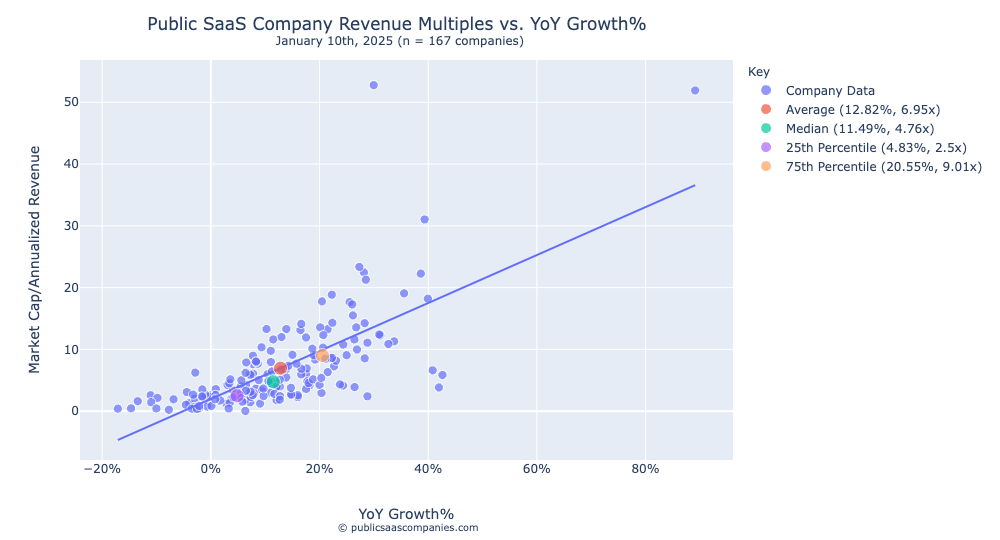
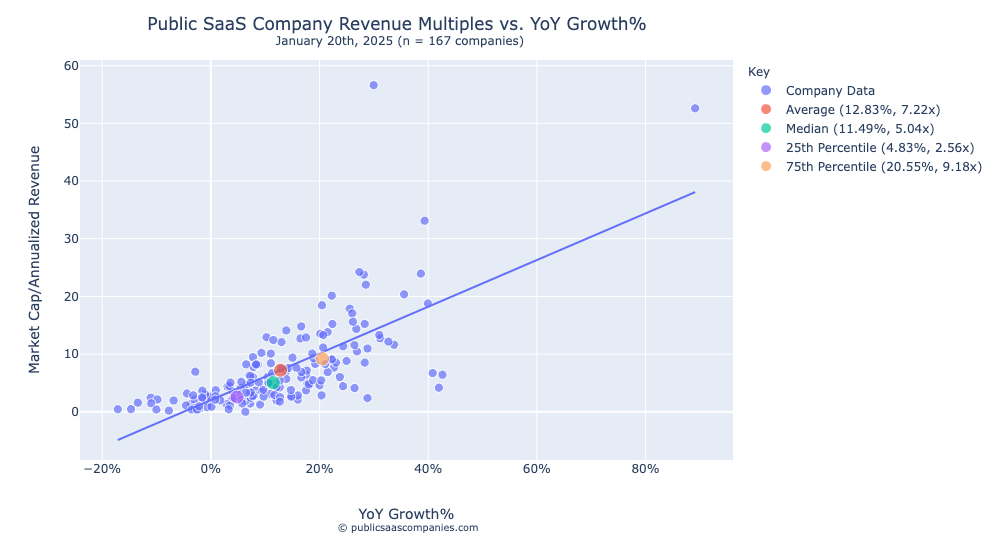
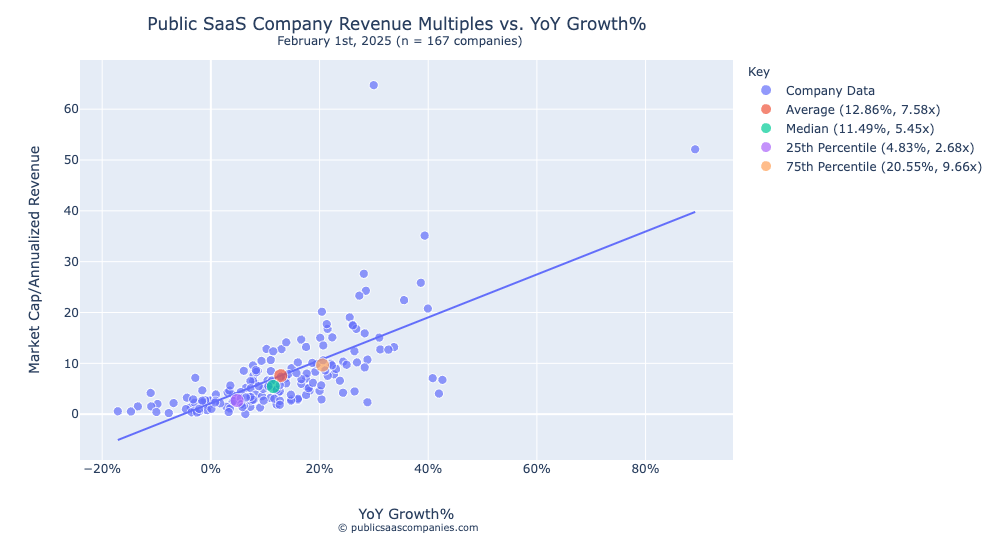
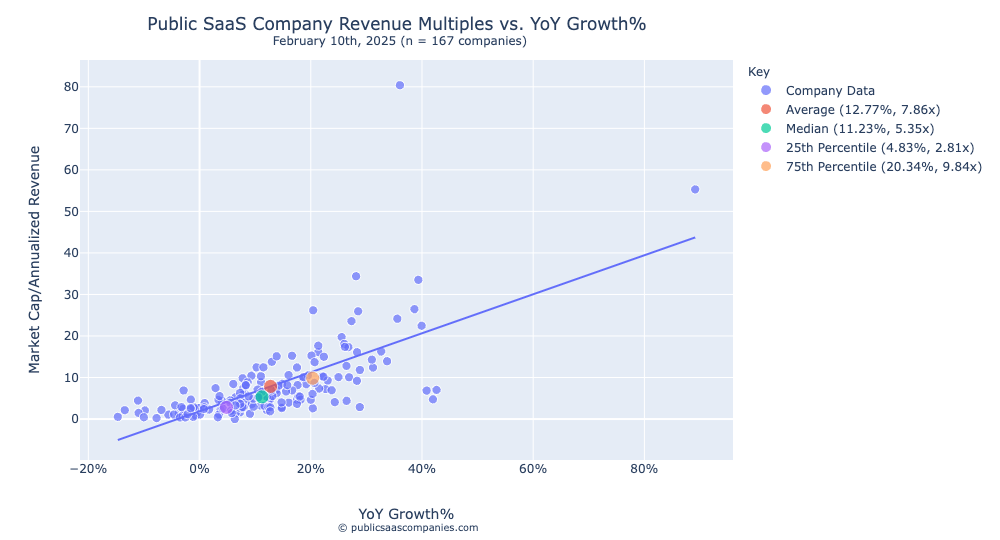
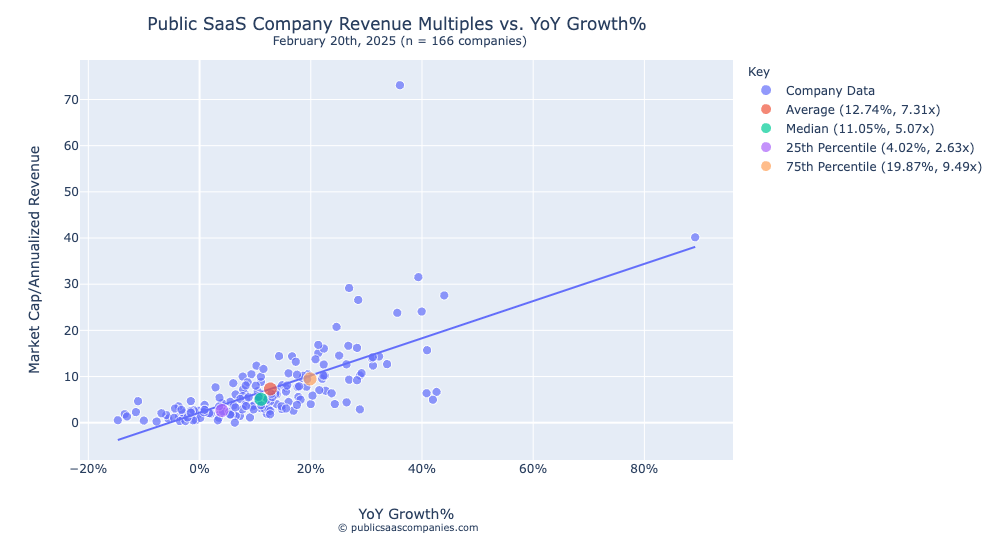
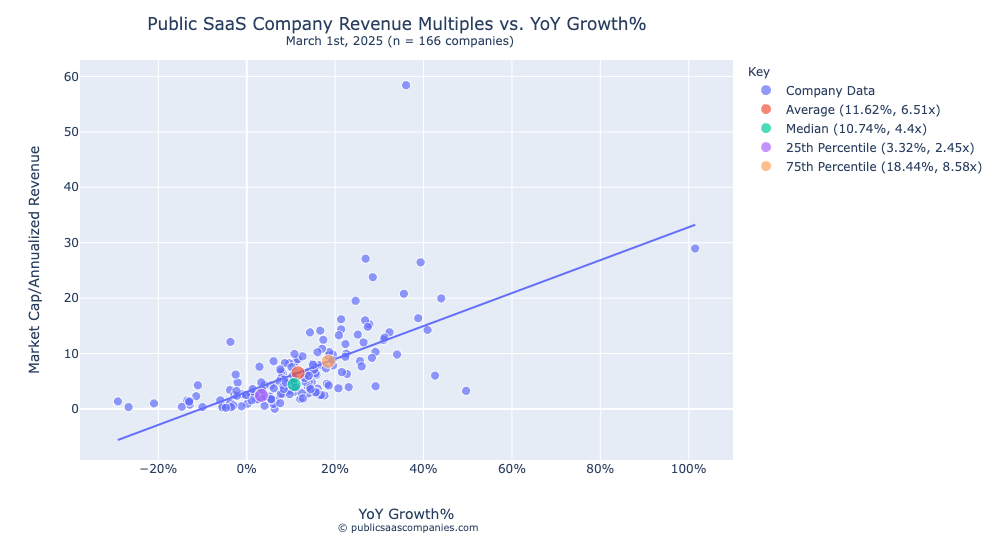
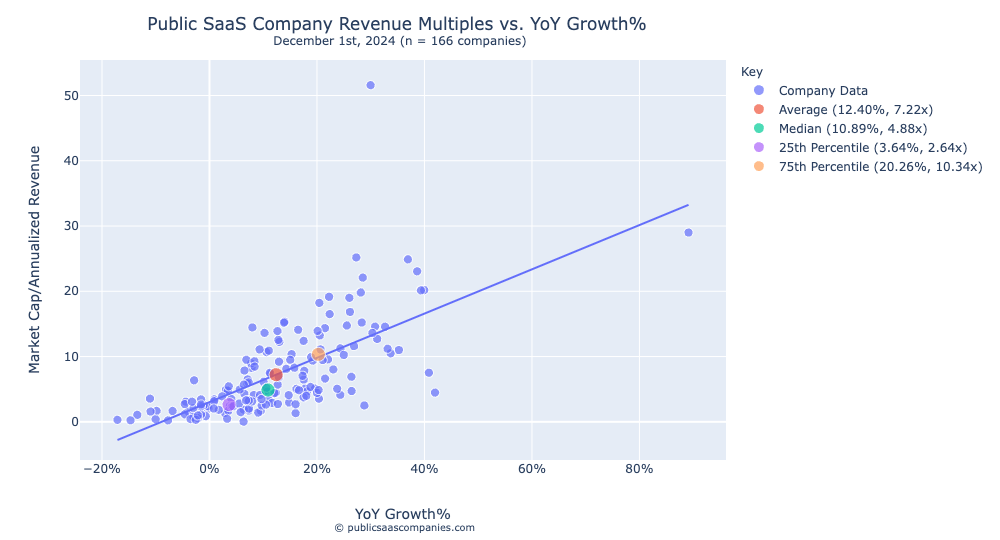
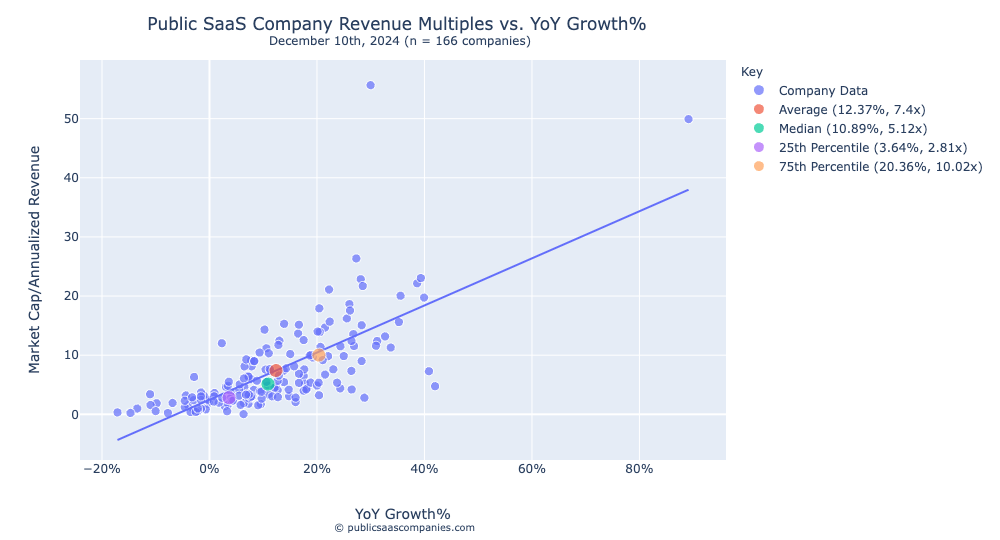
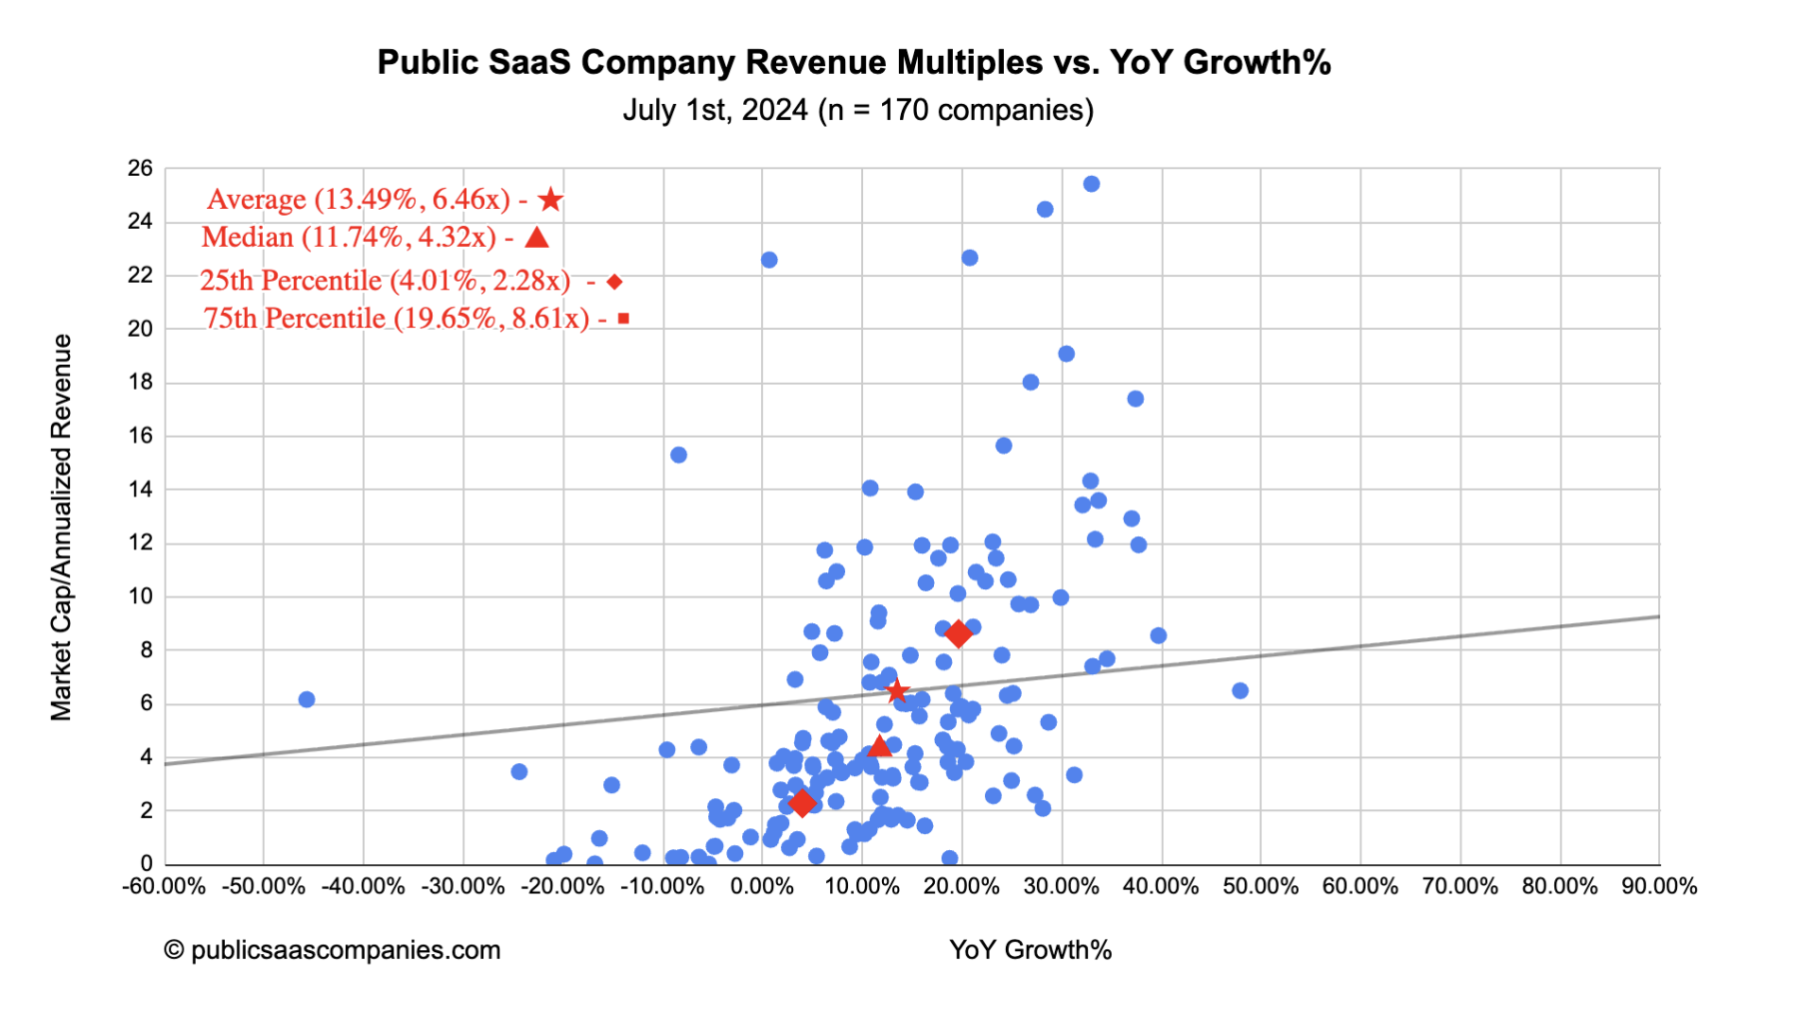
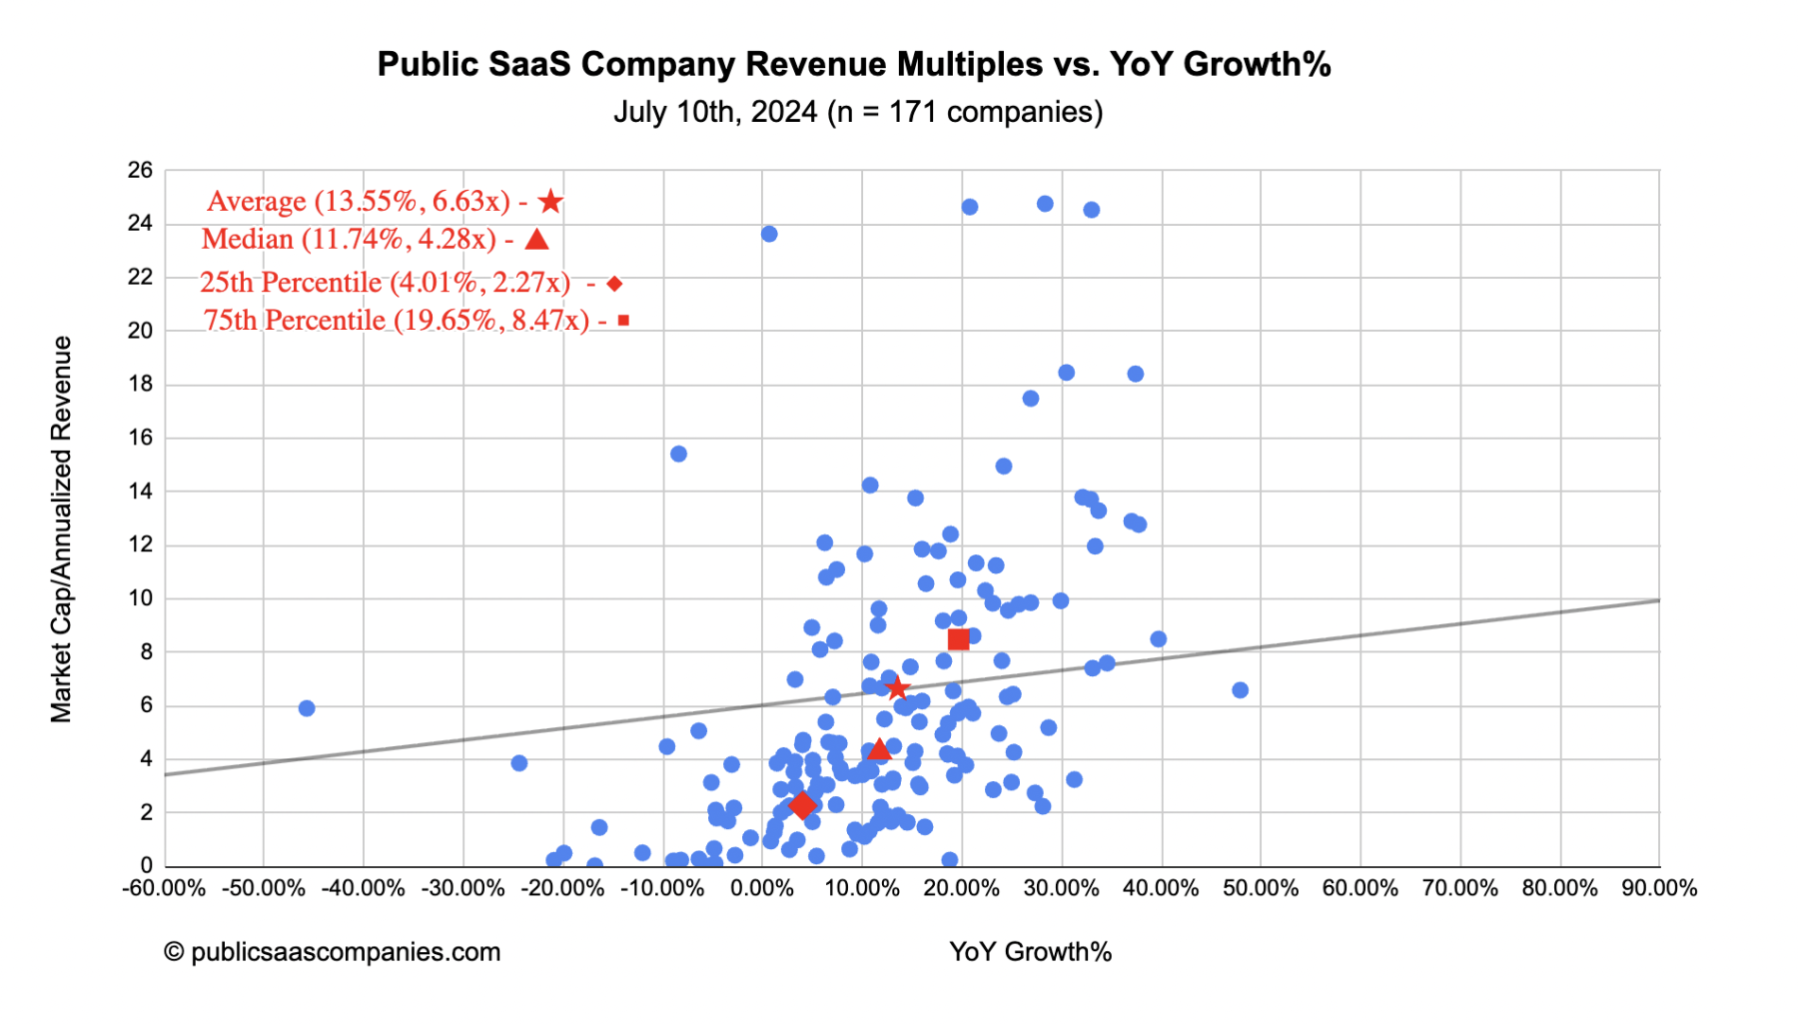
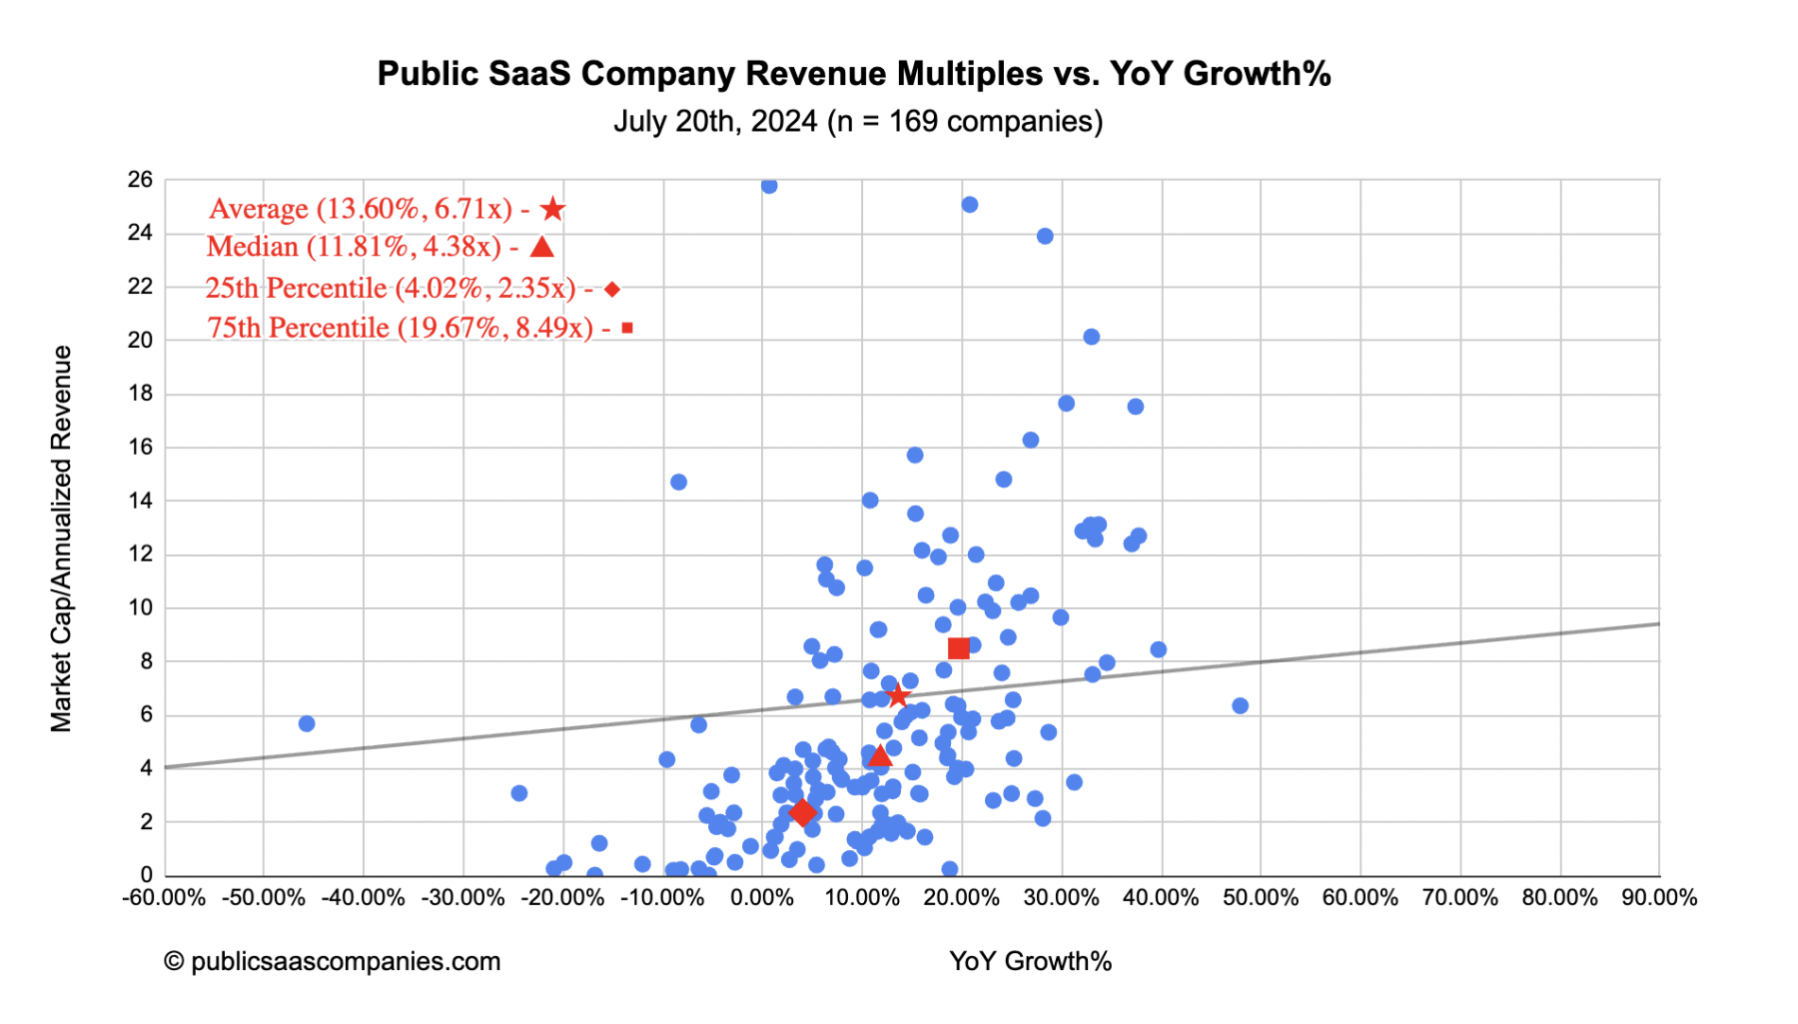
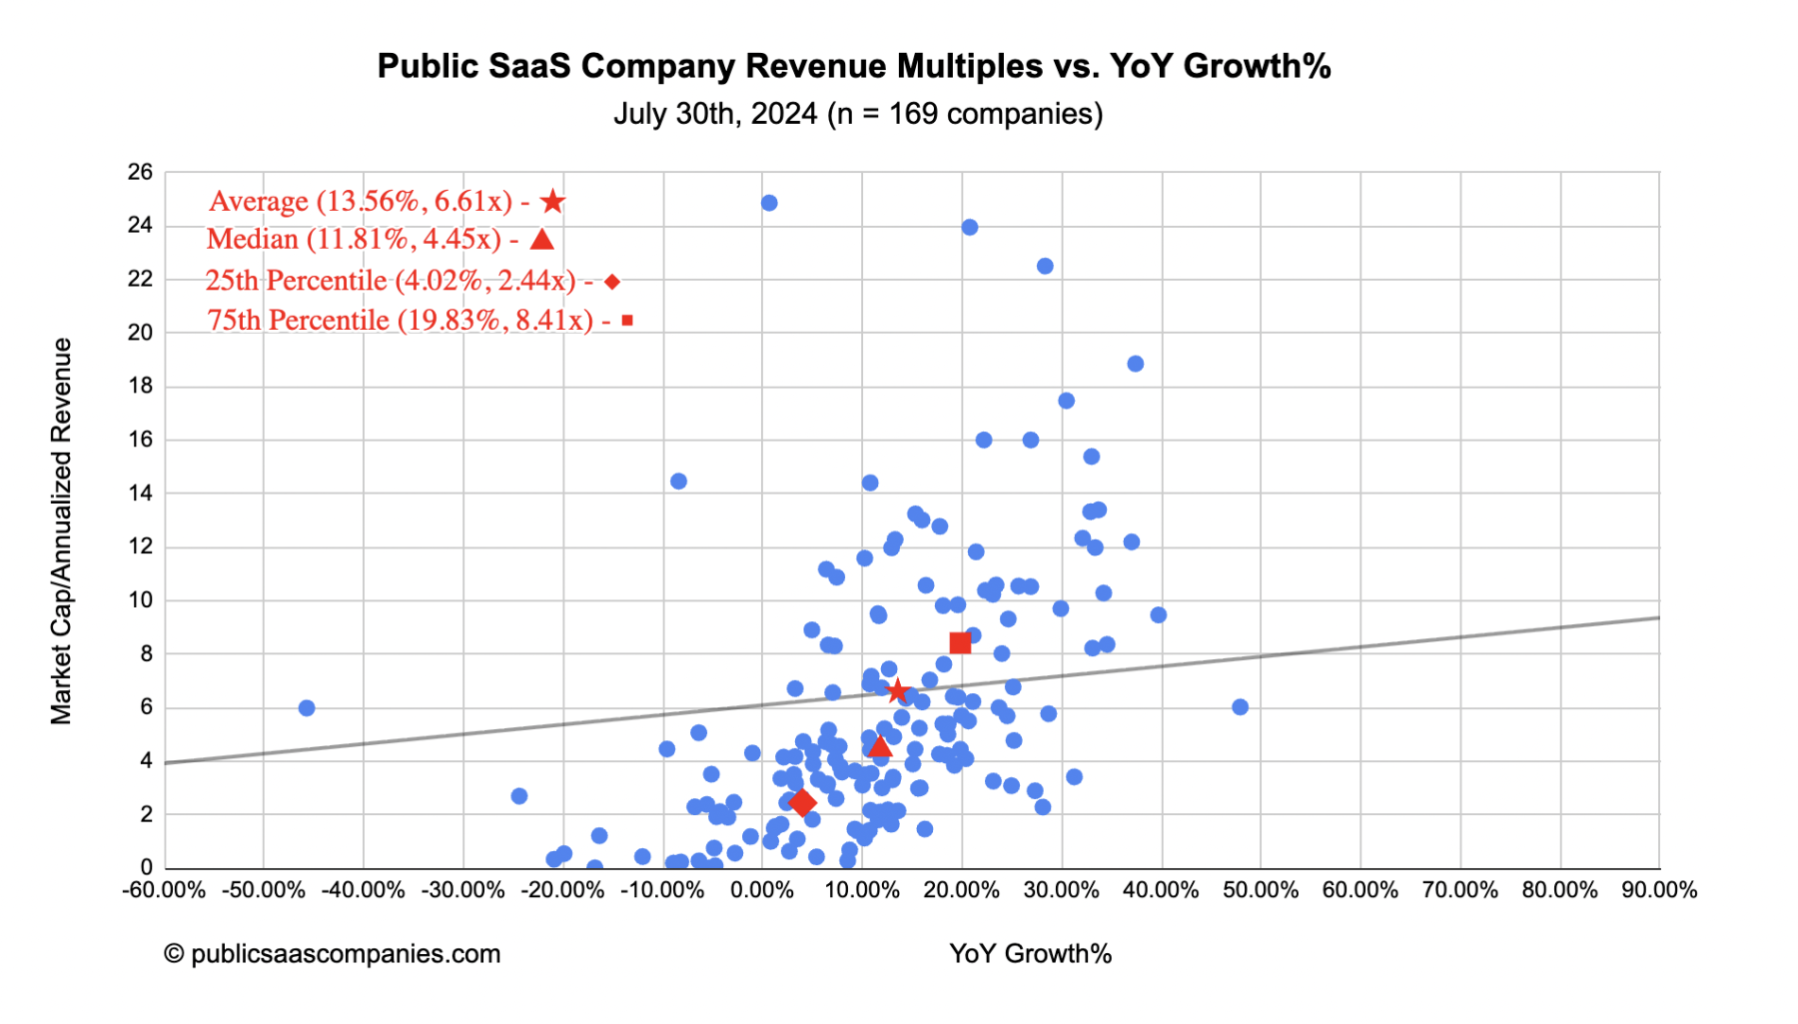
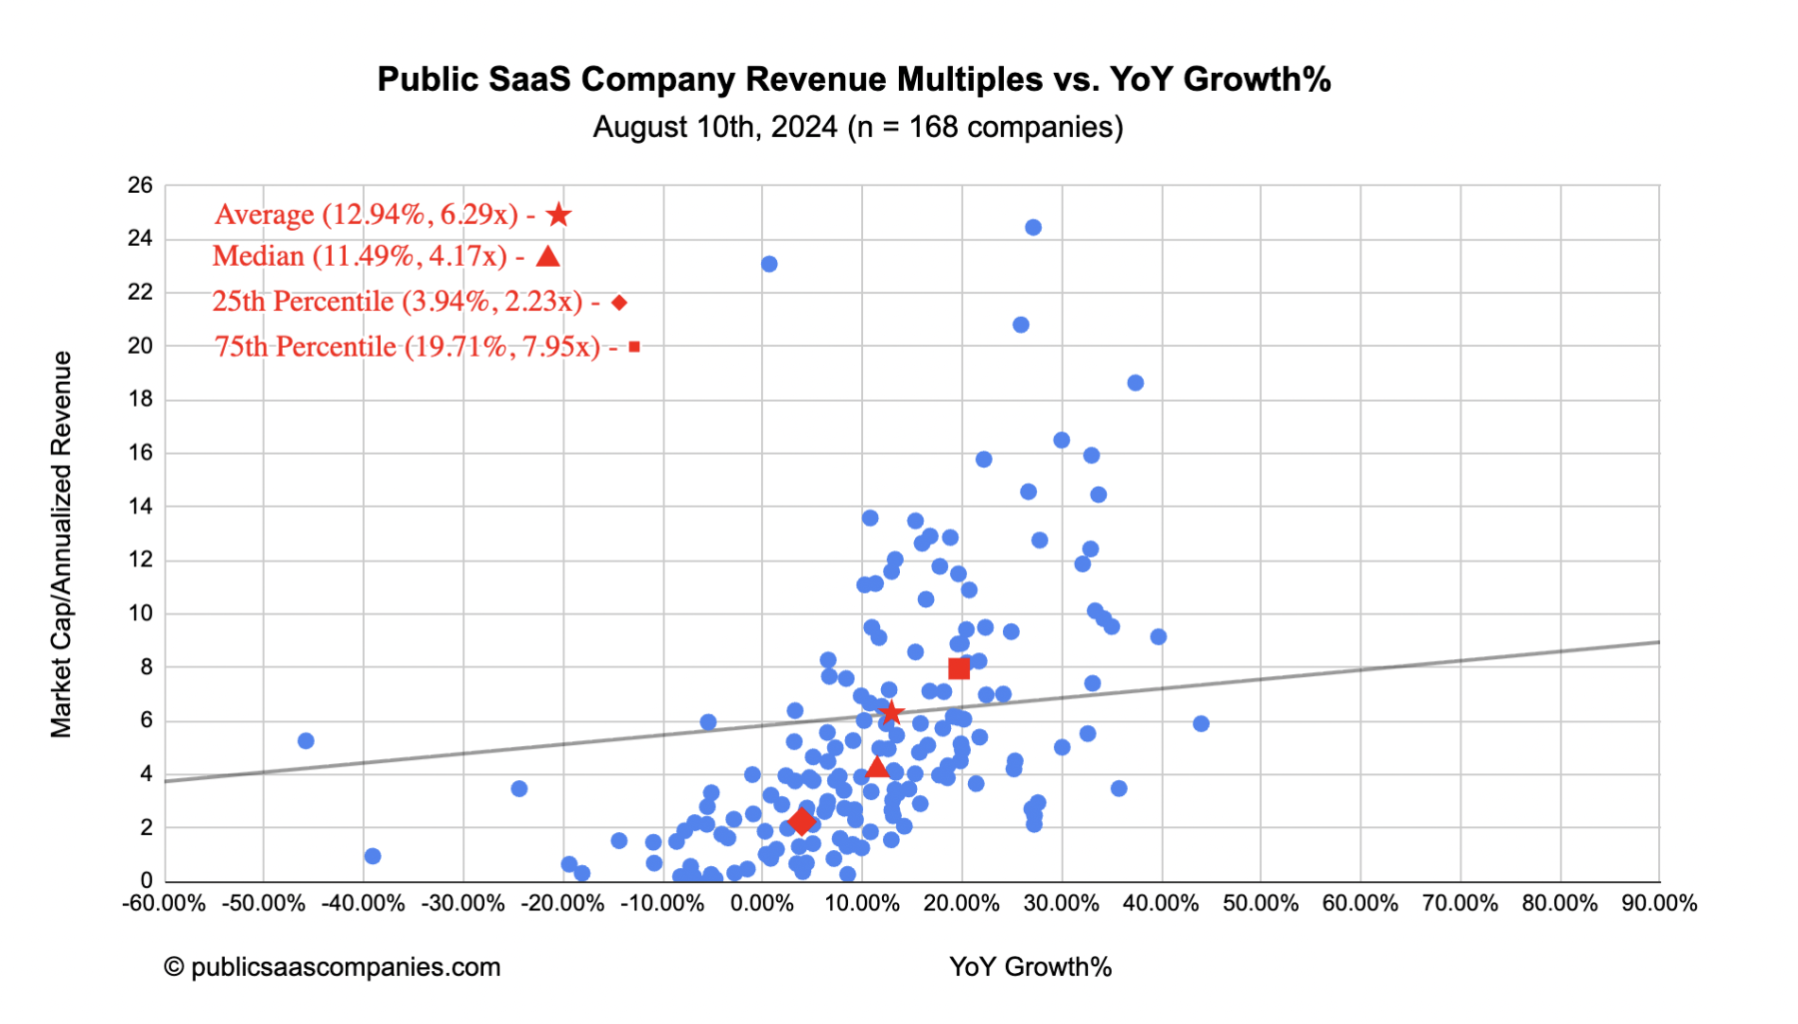
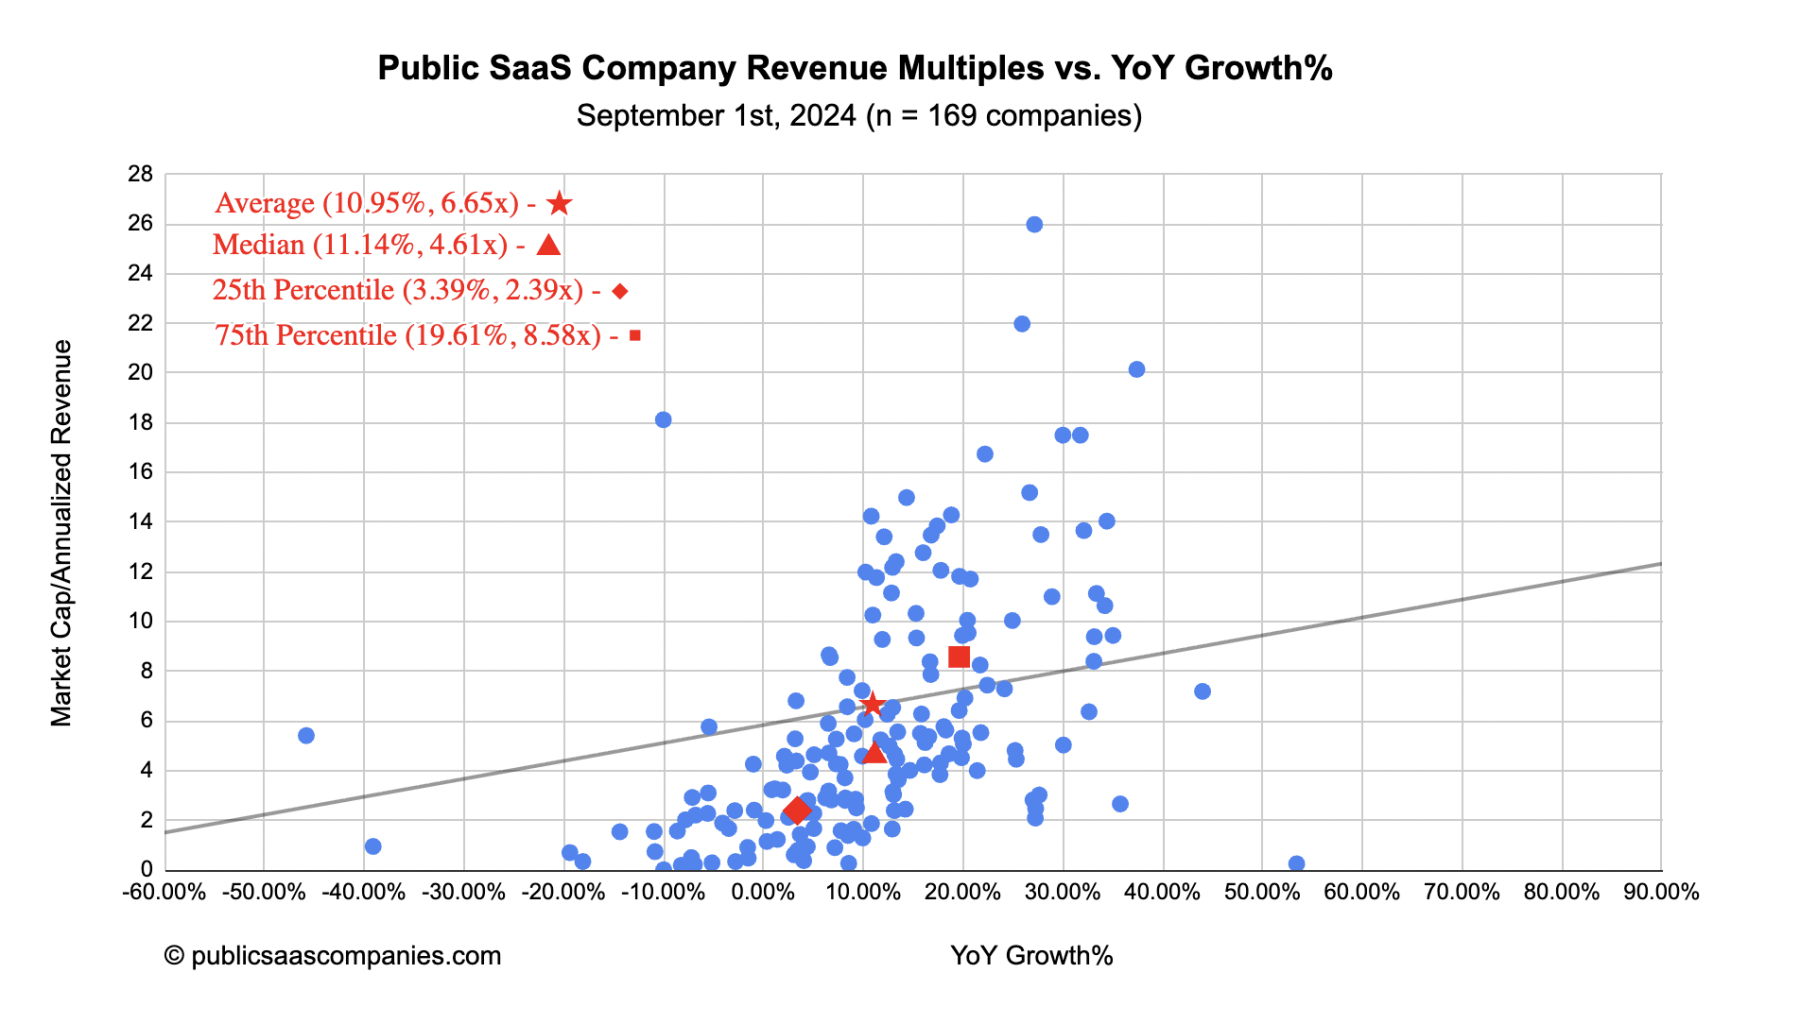
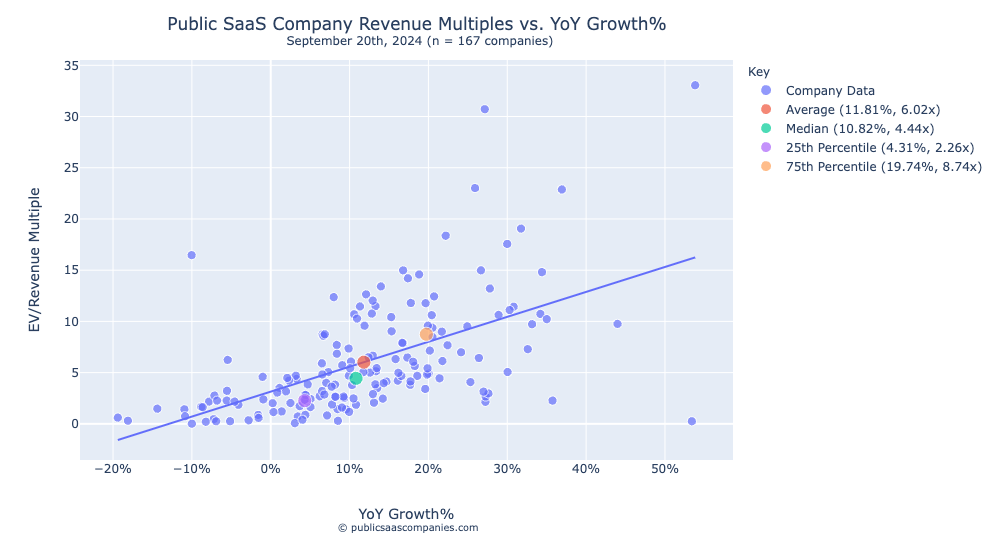
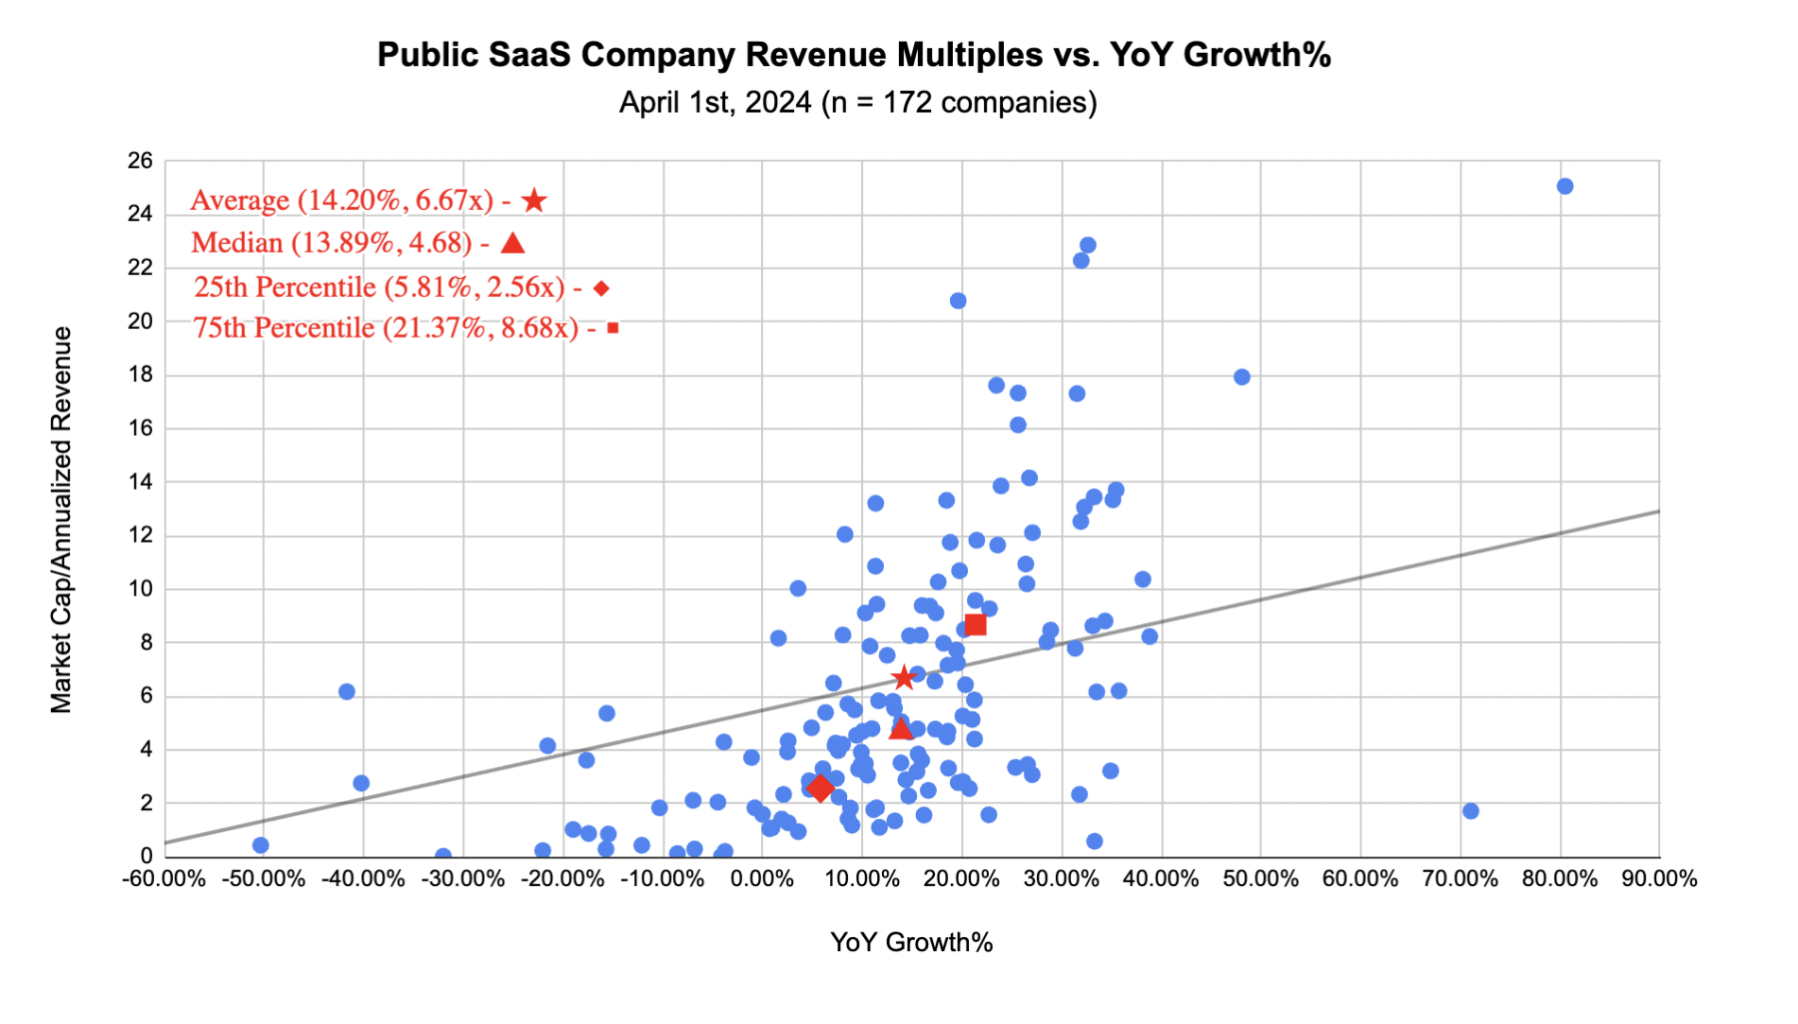
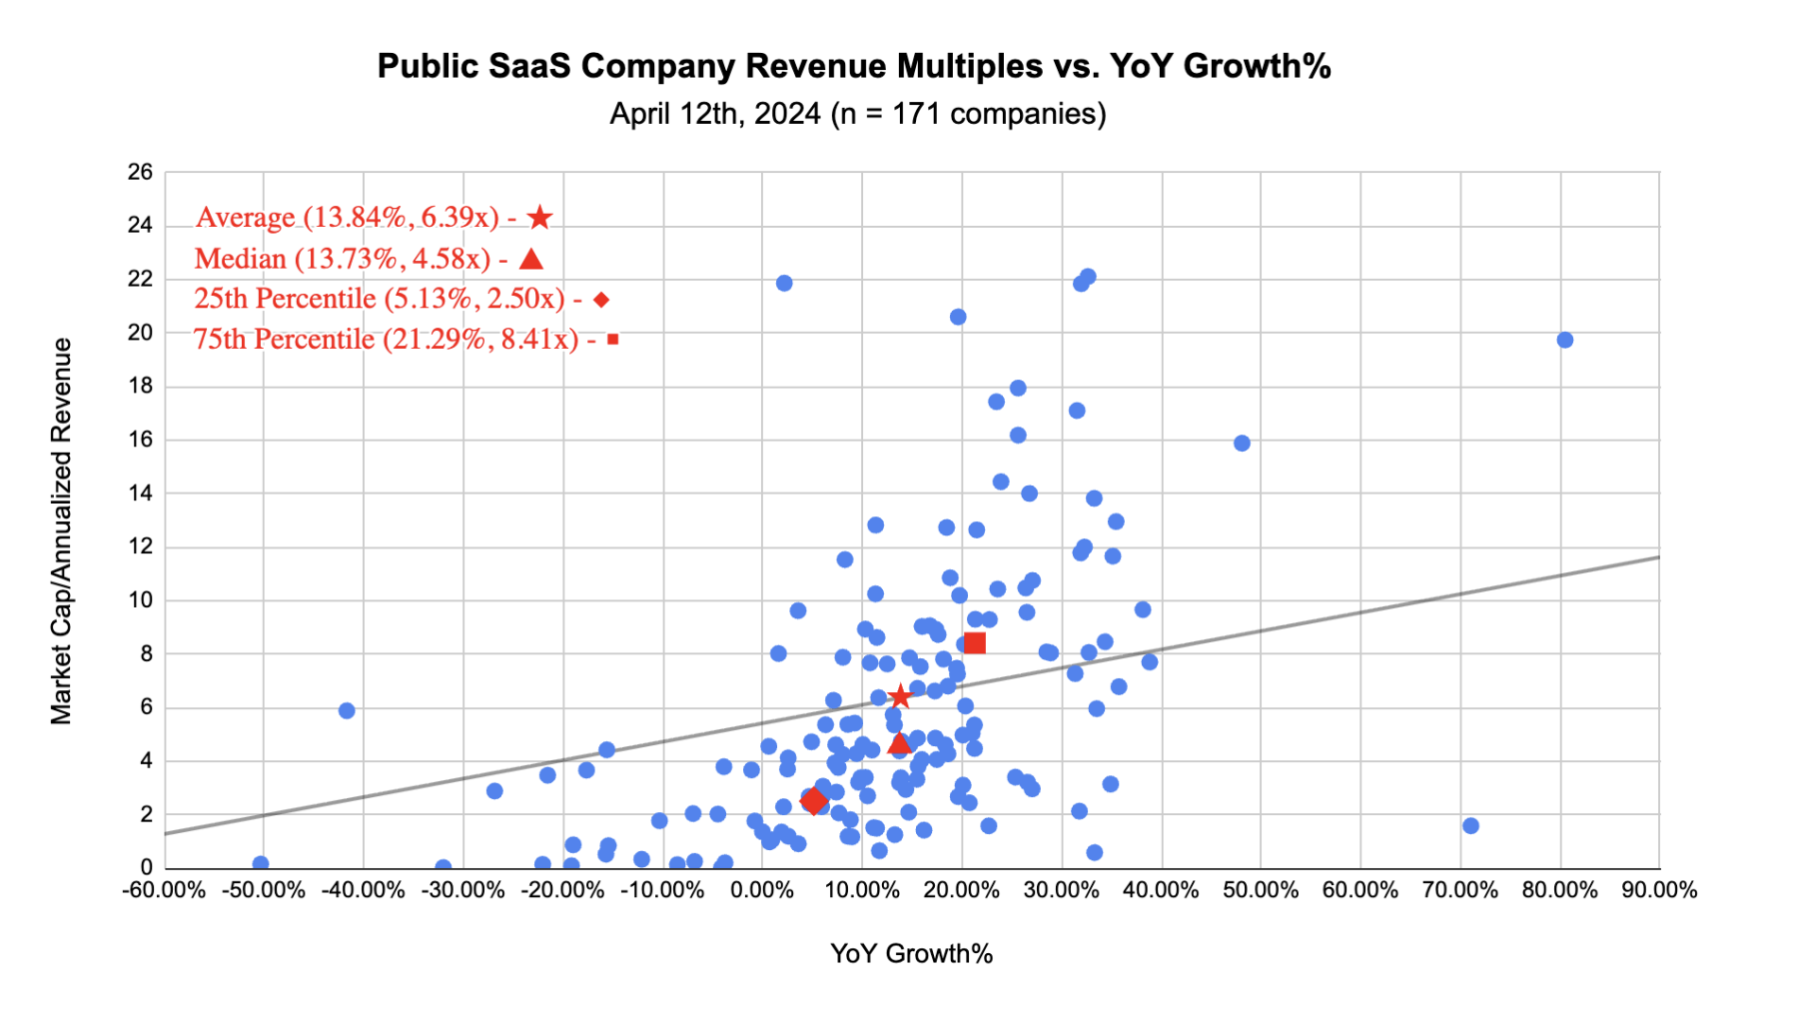
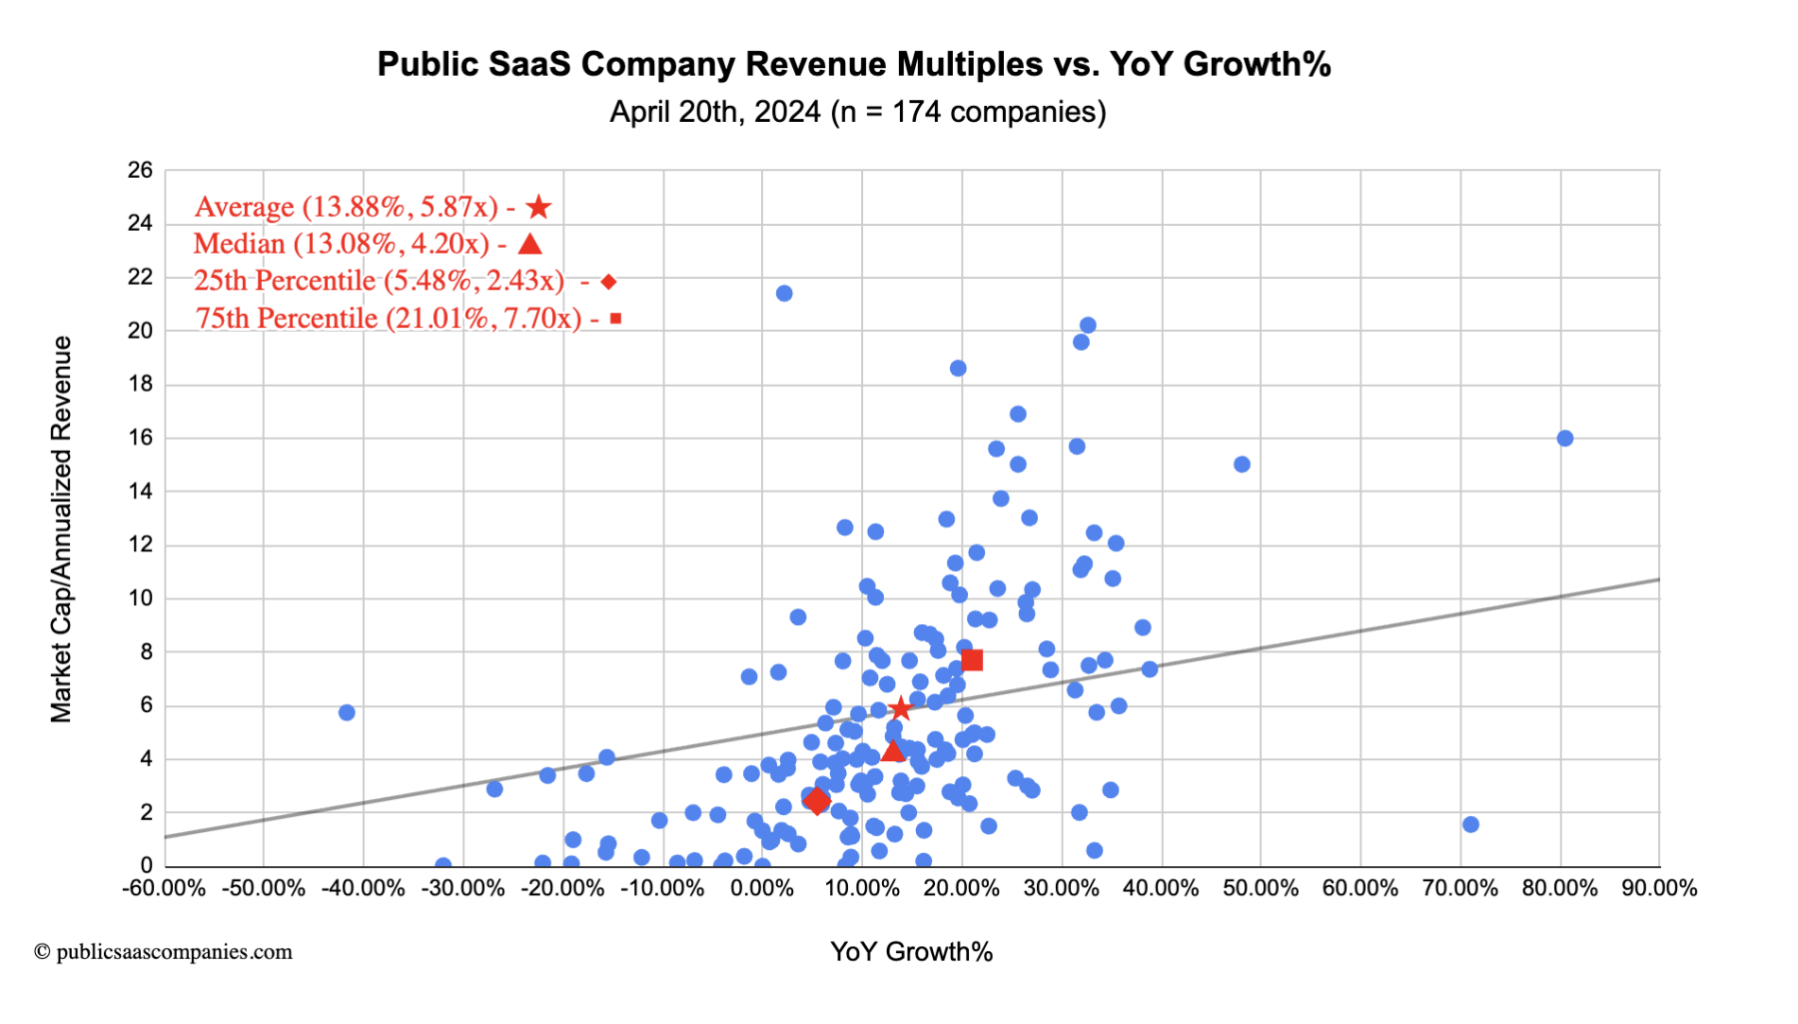
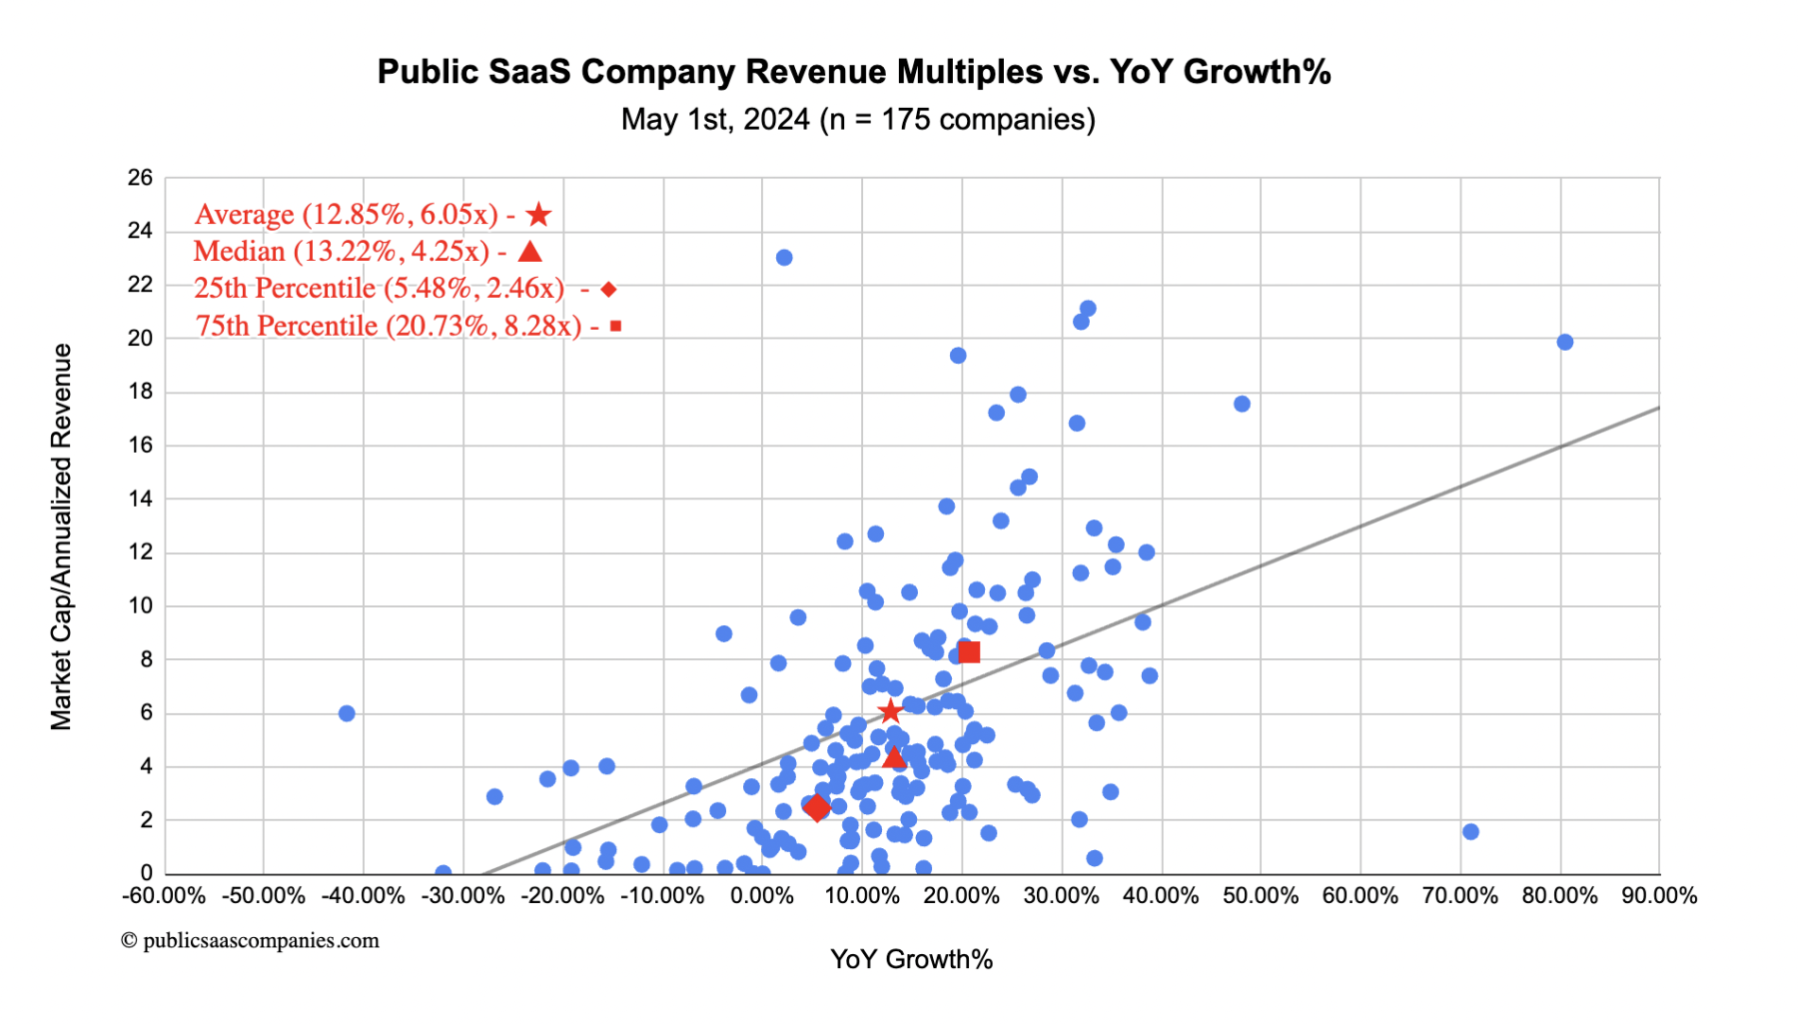
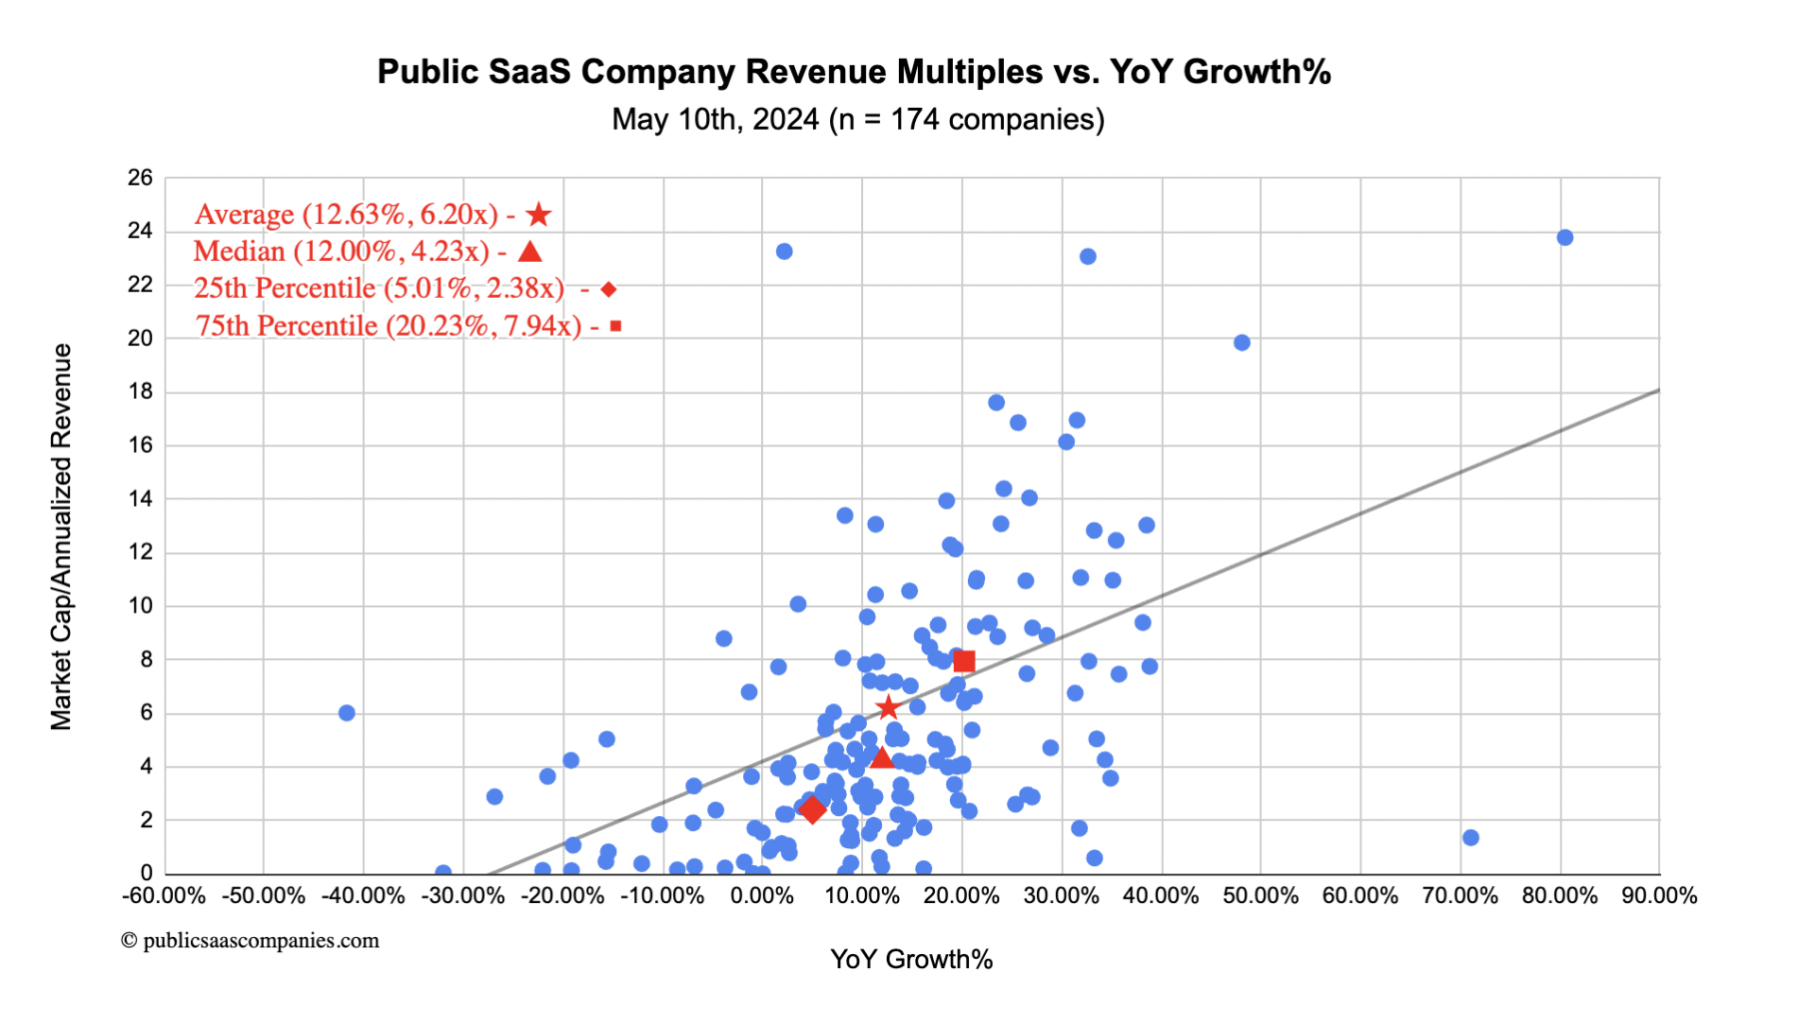
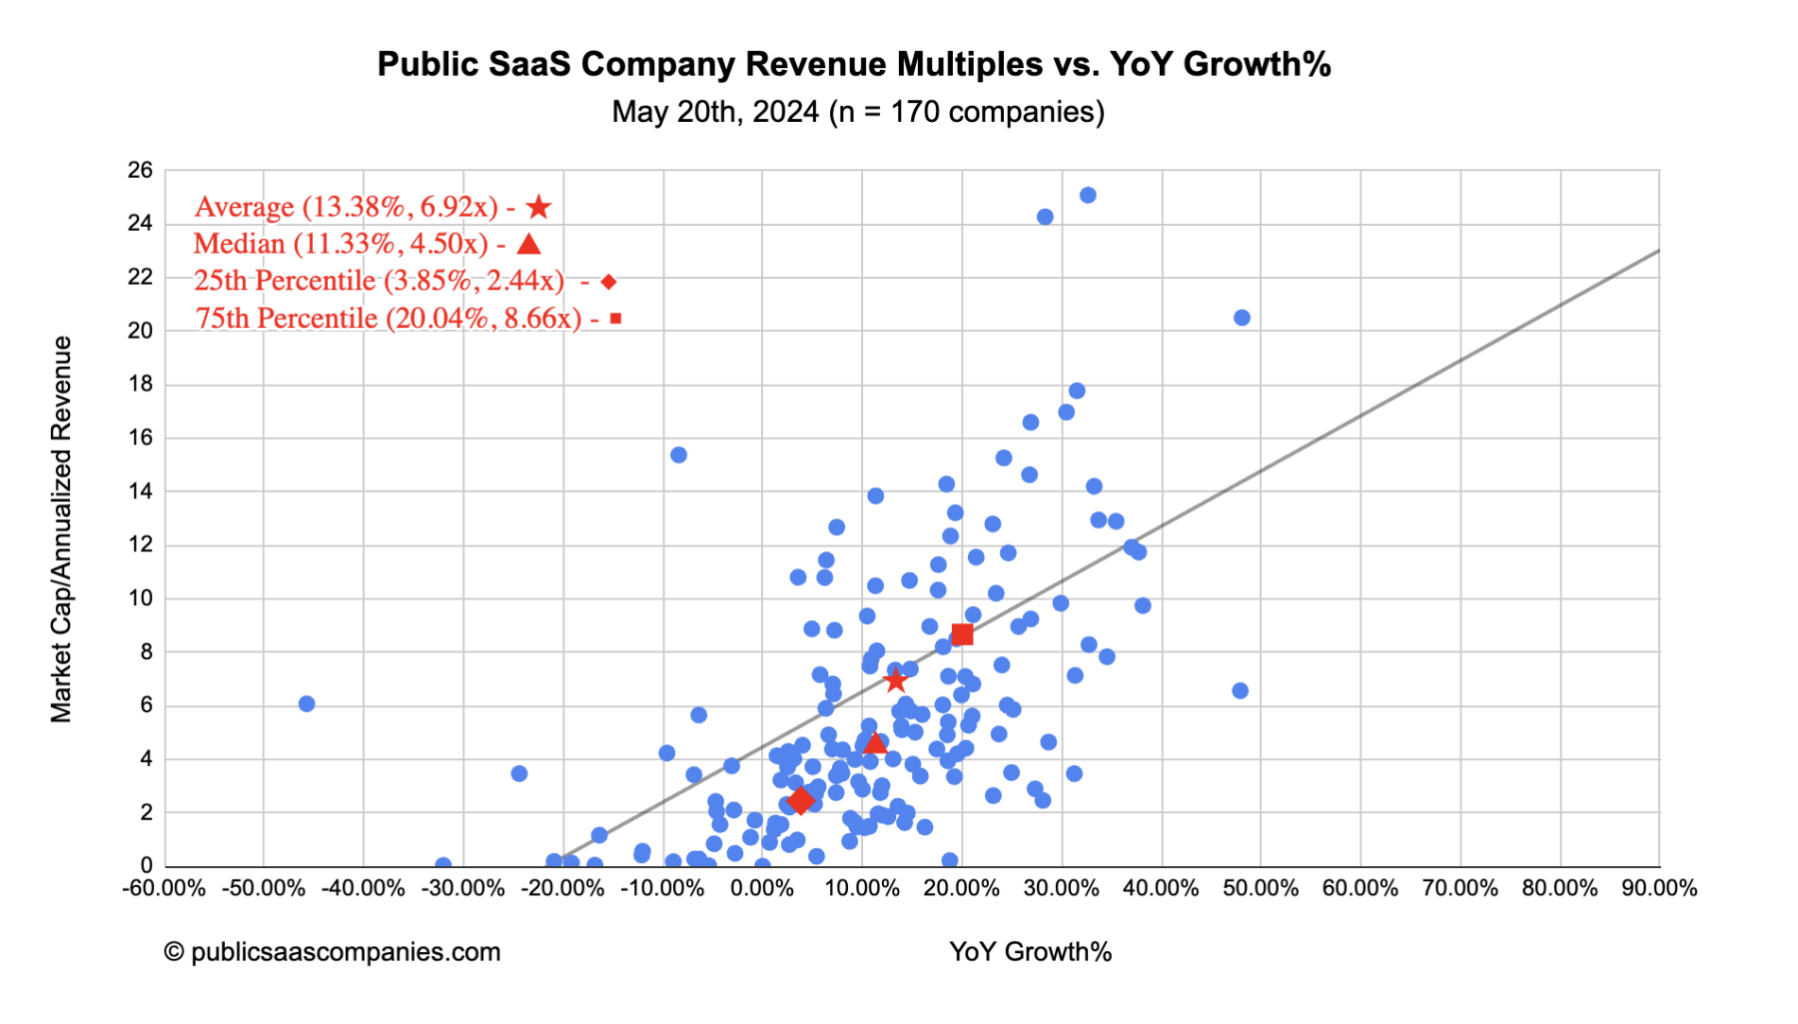
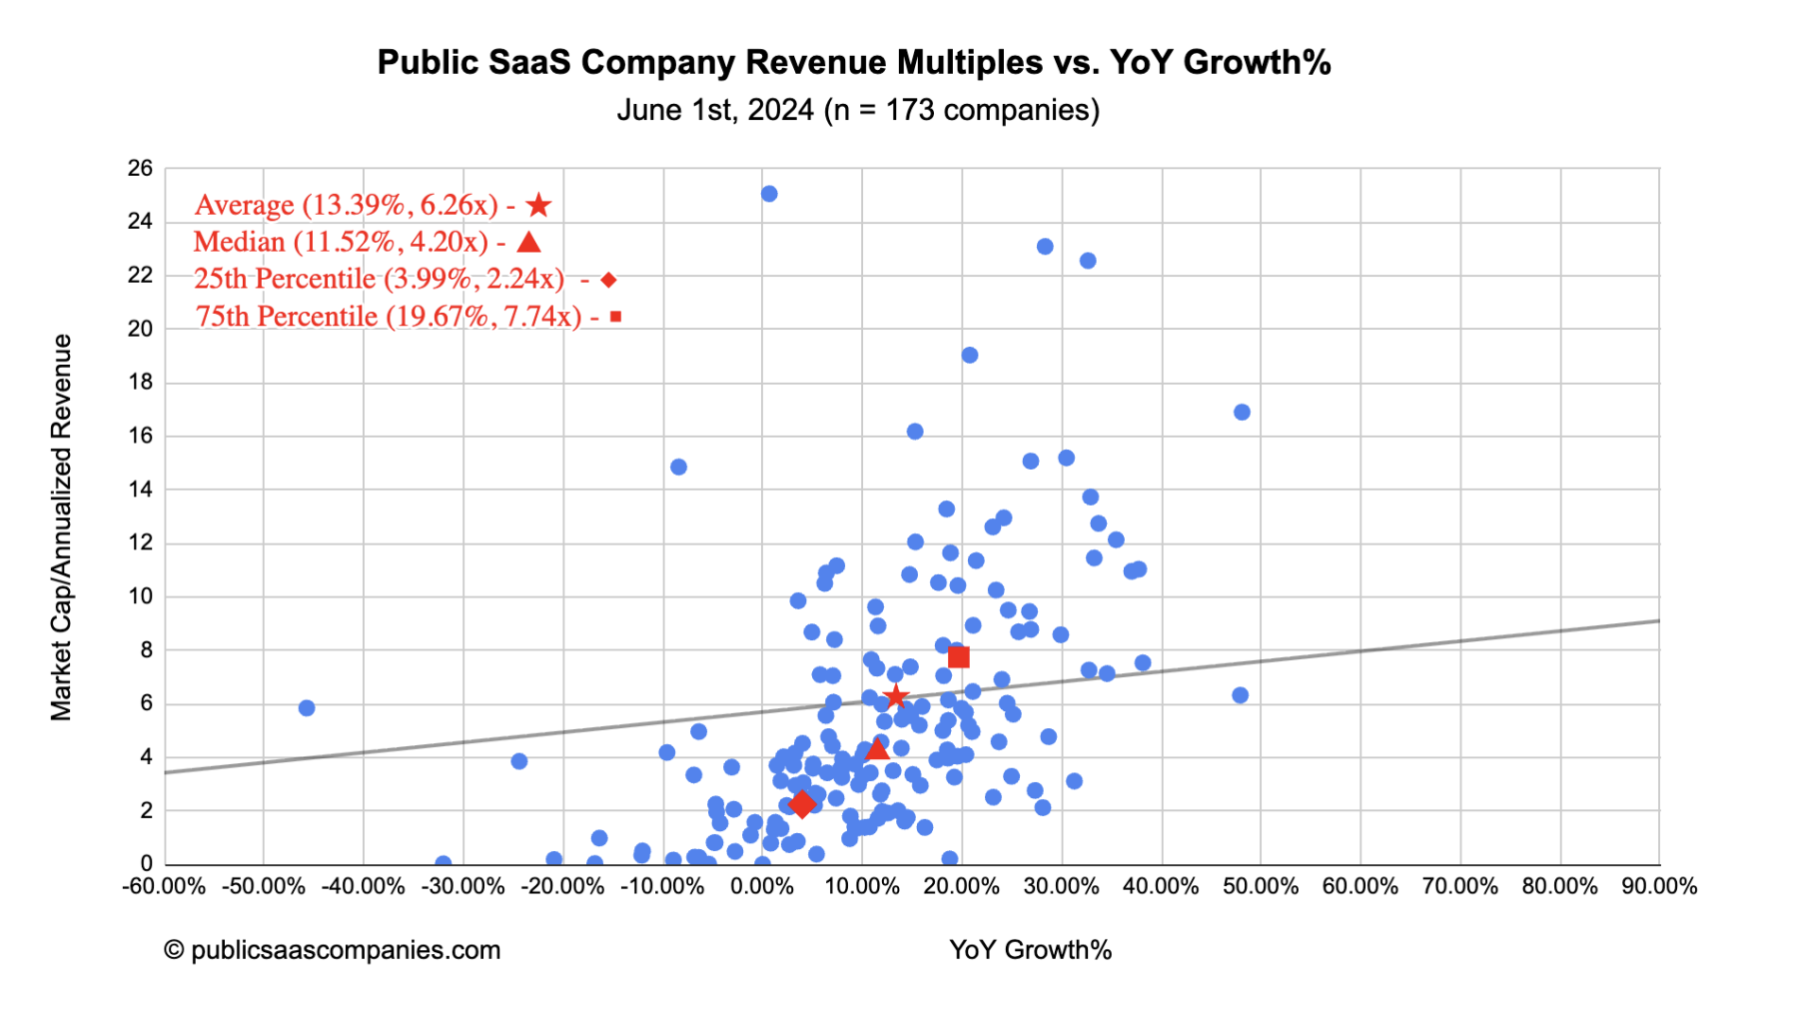
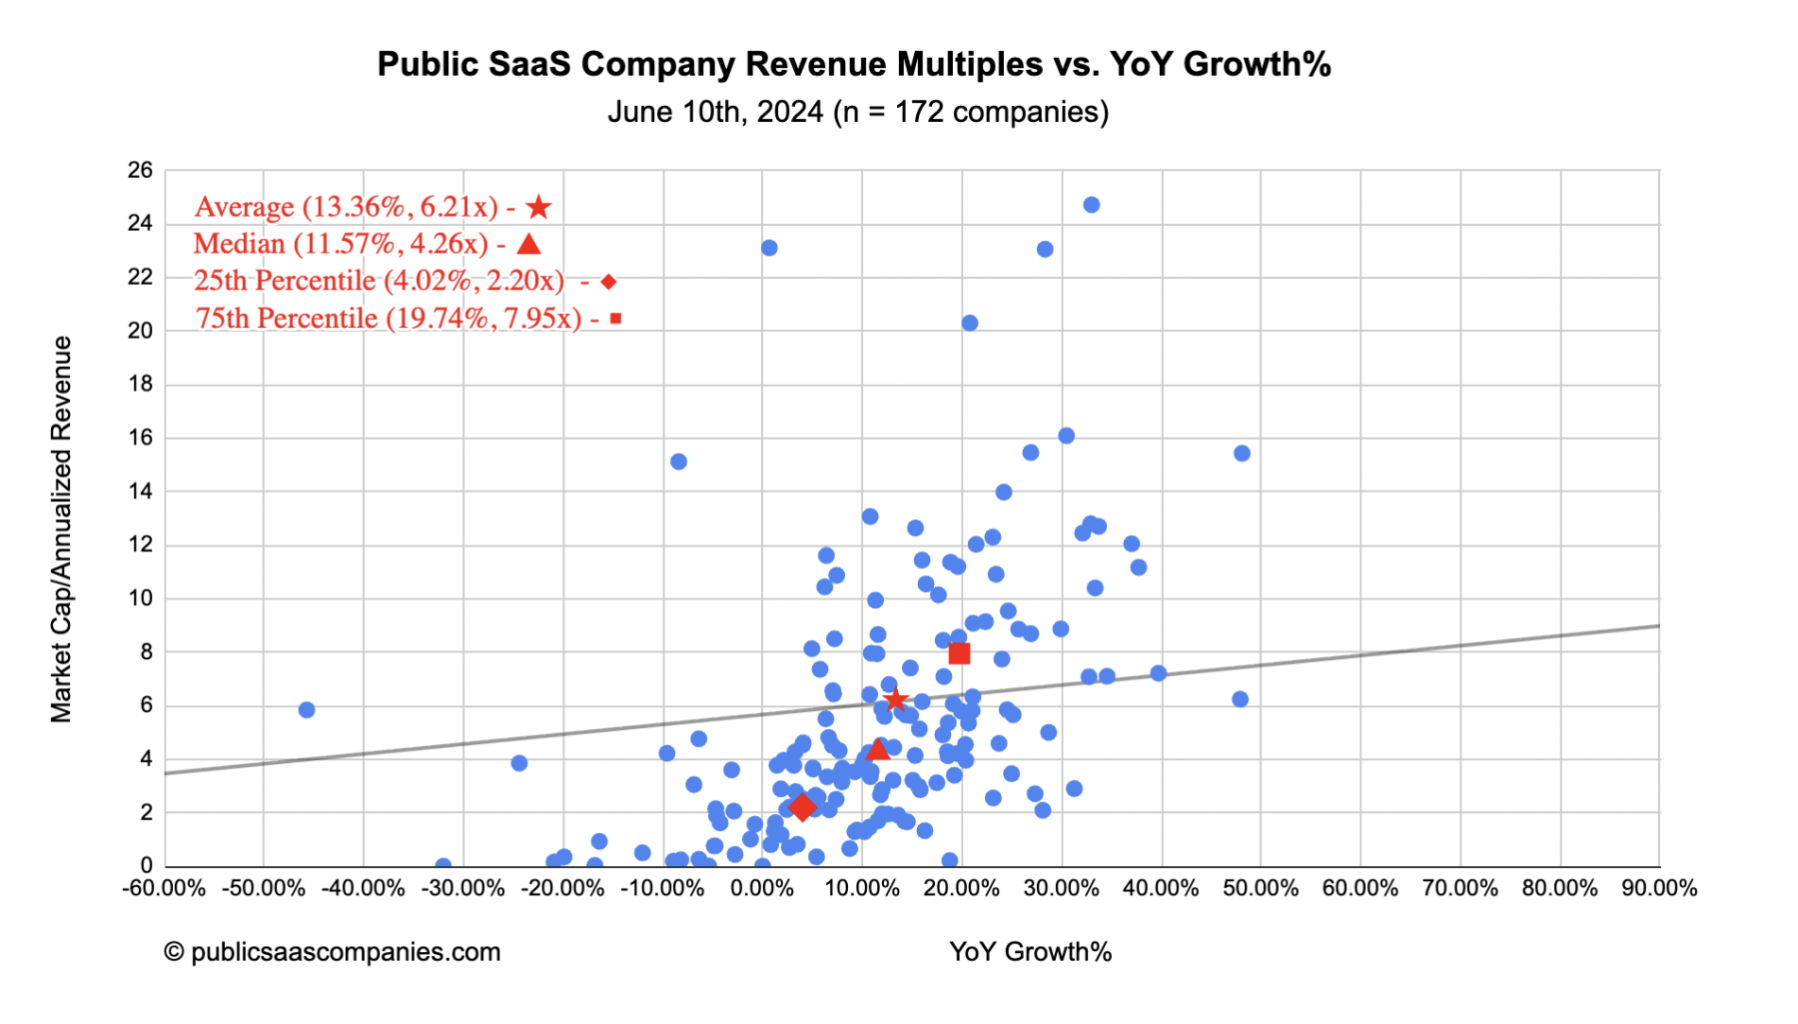
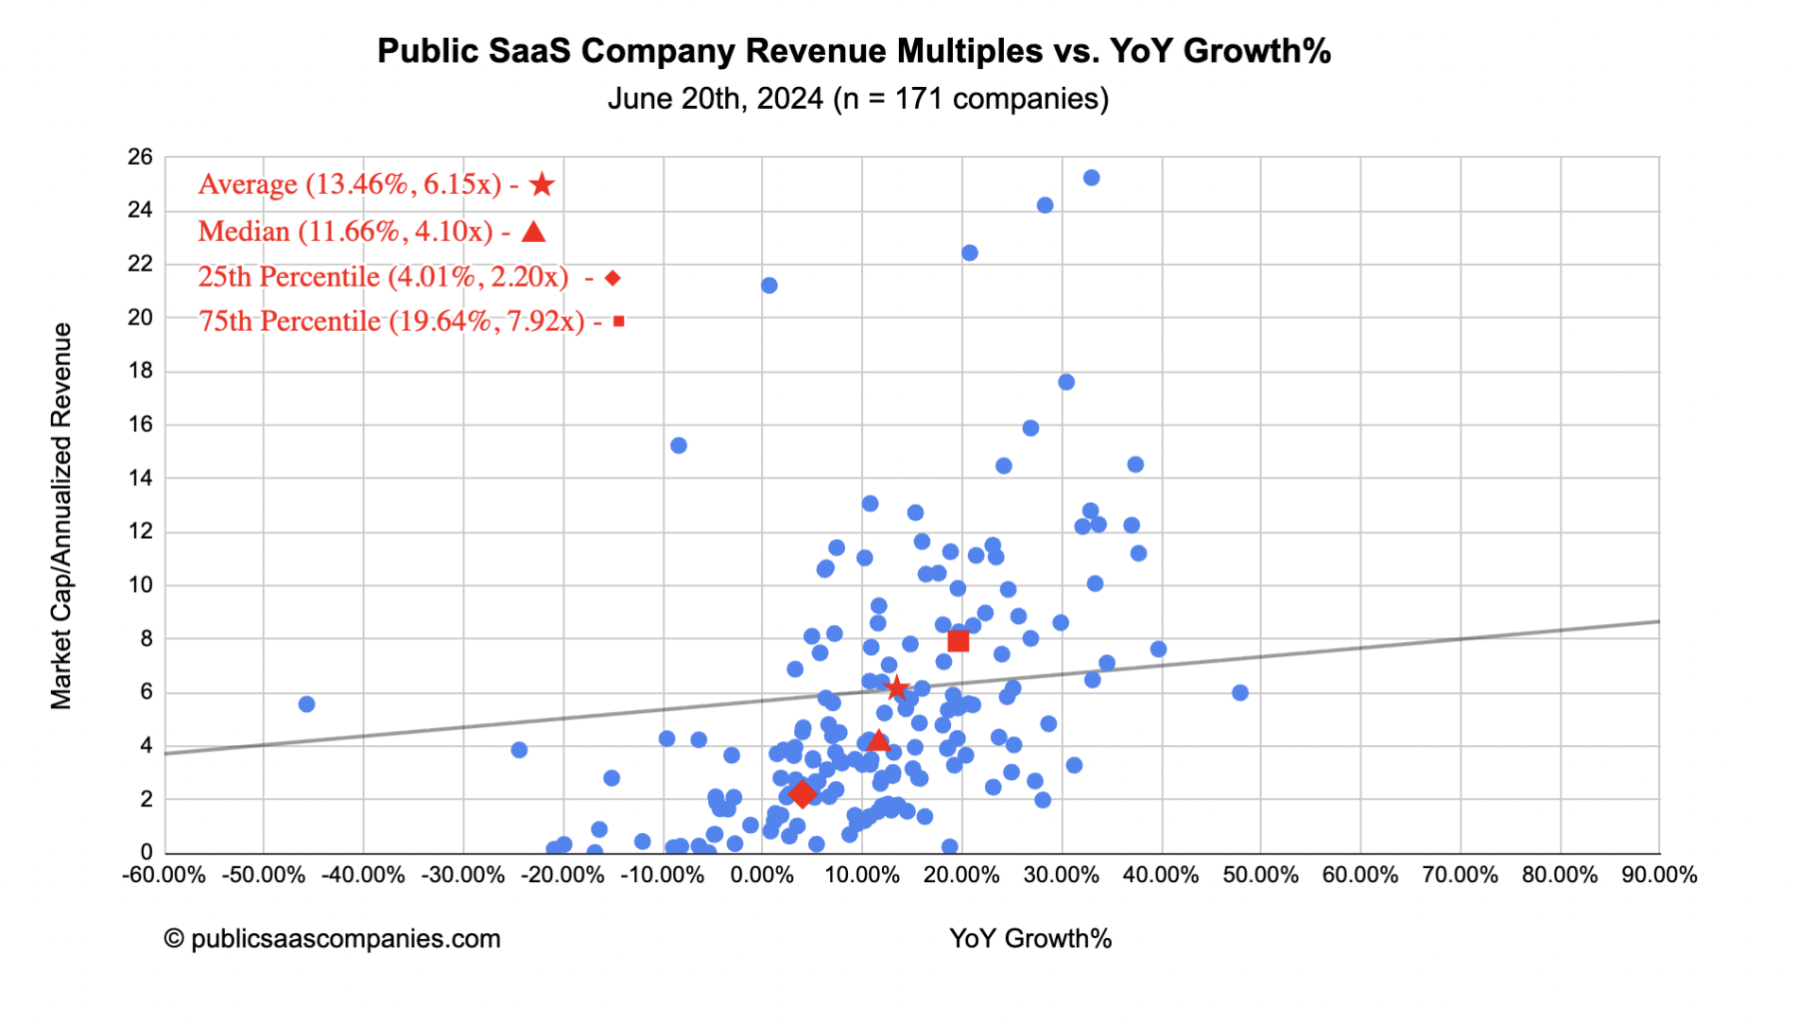
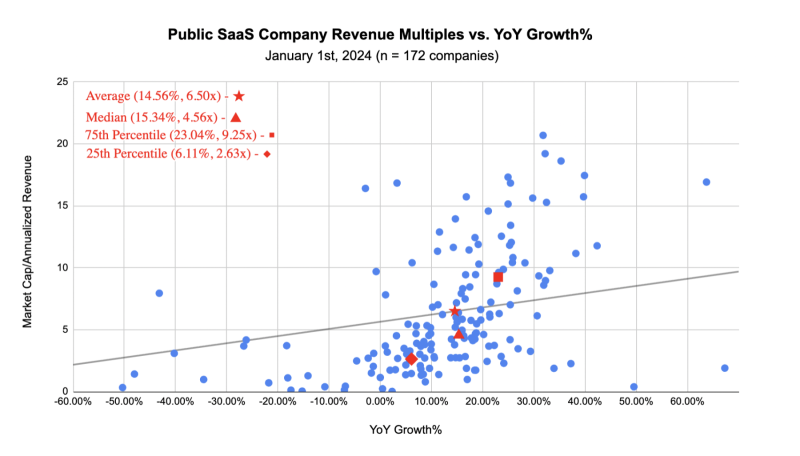
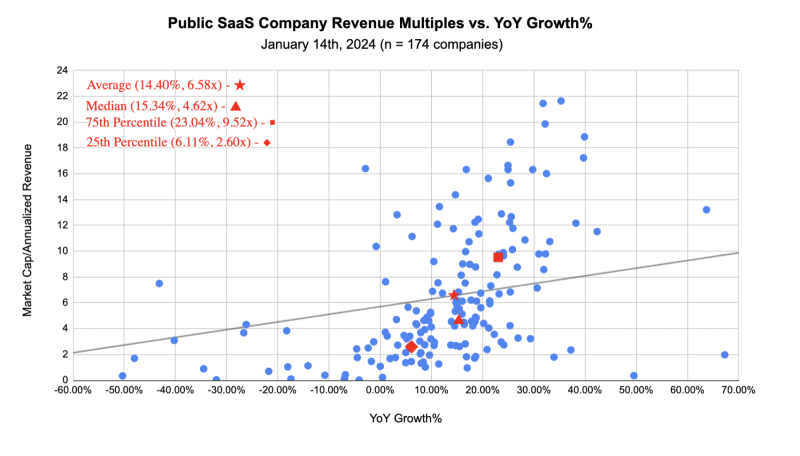
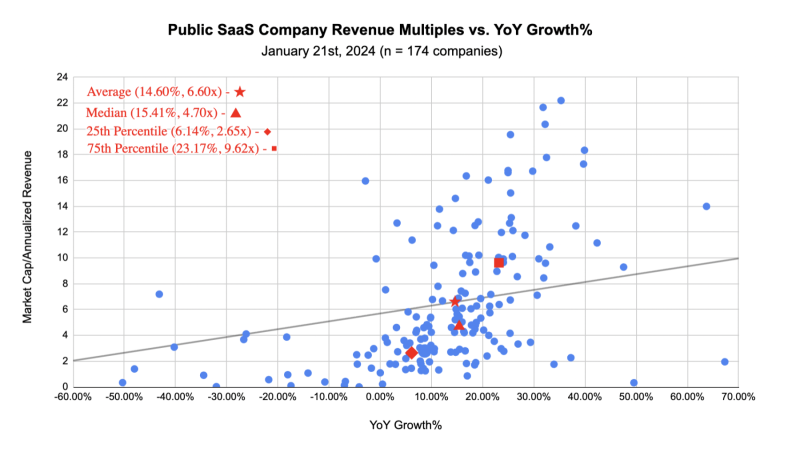
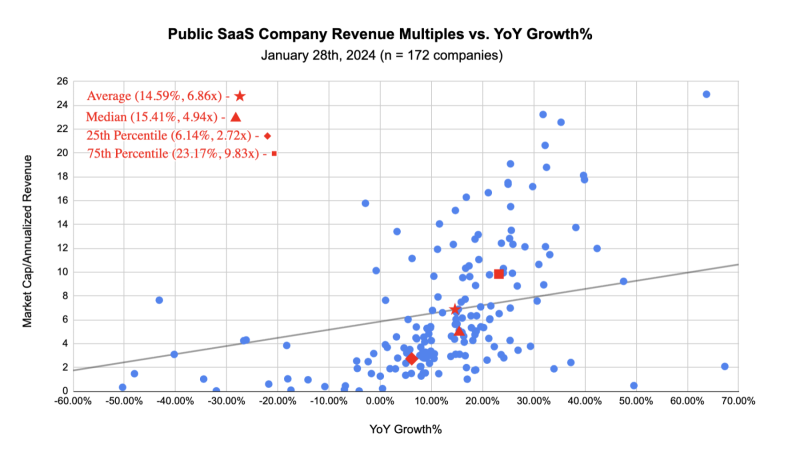
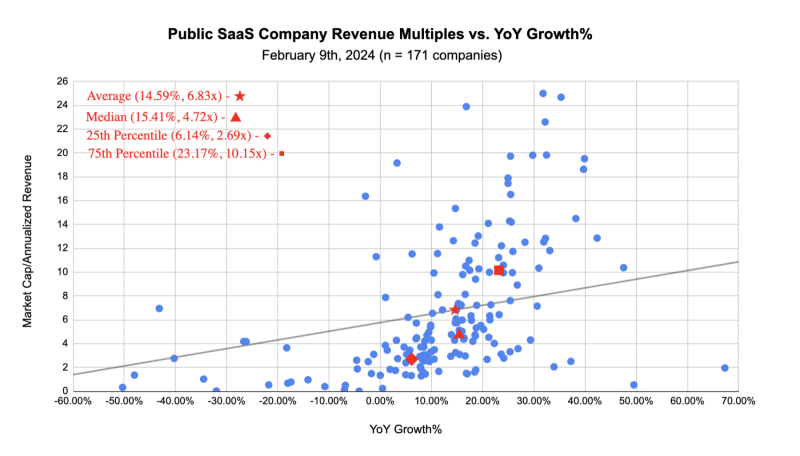
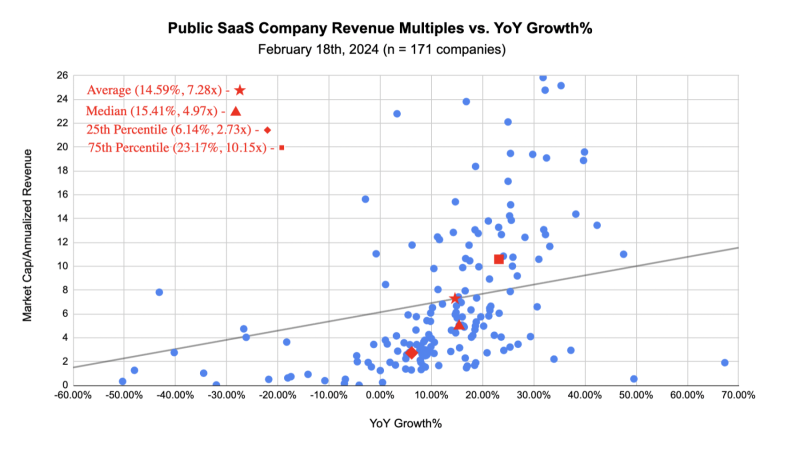
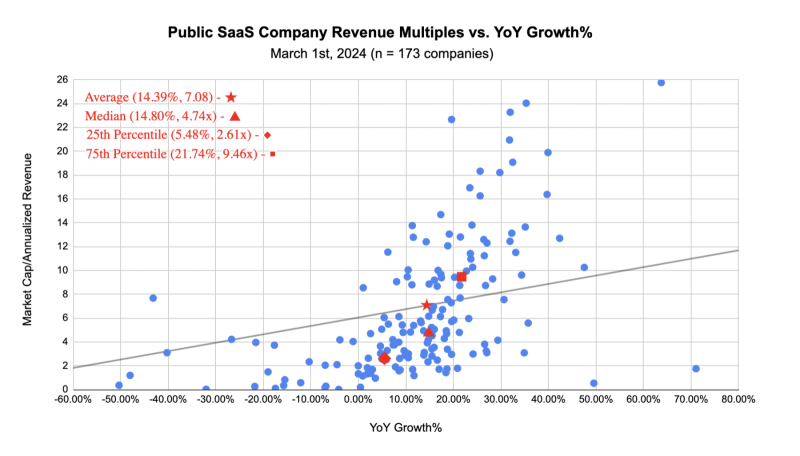
Historical Revenue Multiples vs YoY Growth% charts